Bubble Plots
View Patterns in Multidimensional Data Using Bubble Plots
A bubble plot is a scatter plot that represents its points as circles, or bubbles. Bubble plots can be dynamic (animated over time) or static (fixed bubbles that do not move). Use bubble plots to:
• dynamically animate bubbles using a time variable, to see patterns and movement across time
• use size and color to clearly distinguish between different variables
• aggregate data (rows) into a single bubble, simplifying the bubble plot
Because you can see up to five dimensions at once (x position, y position, size, color, and time), bubble plots can produce dramatic visualizations and readily show patterns and trends.
Note: Dynamic bubble plots were pioneered by Hans Rosling, Professor of International Health, Karolinska Institutet, and the people involved in the Gapminder.org project.
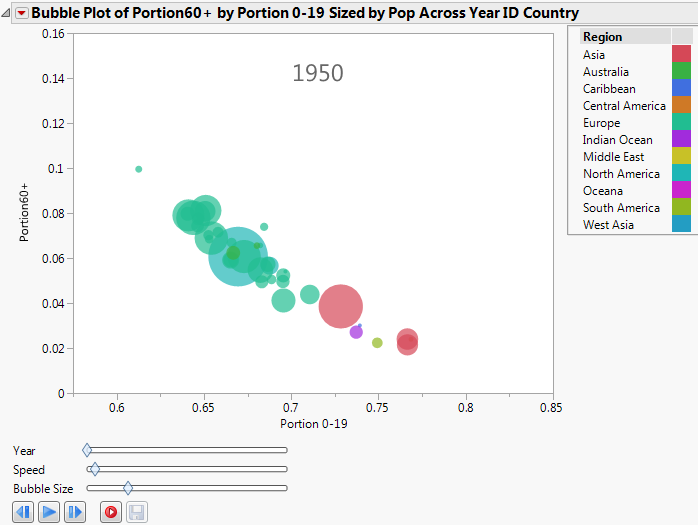
Figure 5.1 Example of a Bubble Plot