Example of Specifying Only ID Variables and Splitting a Bubble
For static bubble plots, you might specify one or two ID variables and no Time variable. The resulting bubble plot contains a bubble at each ID value. Note that although this bubble plot is static, you can perform splitting on bubbles.
1. Select Help > Sample Data Library and open PopAgeGroup.jmp.
2. Select Graph > Bubble Plot.
3. Select Portion60+ and click Y.
4. Select Portion 0-19 and click X.
5. Select Region and Country and click ID.
6. Select Region and click Coloring.
7. Click OK.
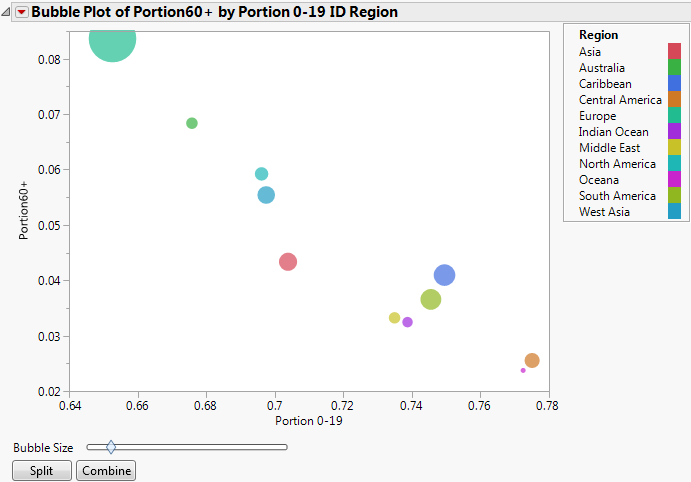
The initial report window appears. (Figure 5.9 uses the default JMP colors.)
Figure 5.9 Initial Report Window with ID Variables
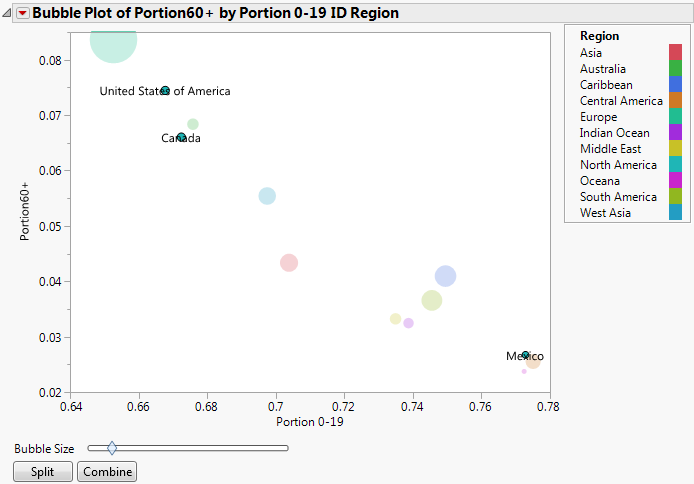
Split the bubble representing the region of North America into countries.
8. Click the bubble representing North America (hover over a bubble to see its label, or use the legend to find the color of North America.)
9. Click Split.
You see that the North America bubble has split into three bubbles, representing the countries within the region of North America (the United States of America, Canada, and Mexico).
Figure 5.10 Splitting the North America Bubble