Compare Averages for One Variable
If you have a continuous Y variable, and a categorical X variable, you can compare averages across the levels of the X variable.
Scenario
This example uses the Companies.jmp data table, which contains financial data for 32 companies from the pharmaceutical and computer industries.
A financial analyst wants to explore the following question:
• How do the profits of computer companies compare to the profits of pharmaceutical companies?
To answer this question, fit Profits ($M) by Type.
Discover the Relationship
1. Select Help > Sample Data Library and open Companies.jmp.
2. If you still have the Companies.jmp sample data table open, you might have rows that are excluded or hidden. To return the rows to the default state (all rows included and none hidden), select Rows > Clear Row States.
3. Select Analyze > Fit Y by X.
4. Select Profits ($M) and click Y, Response.
5. Select Type and click X, Factor.
6. Click OK.
Figure 5.15 Profits by Company Type
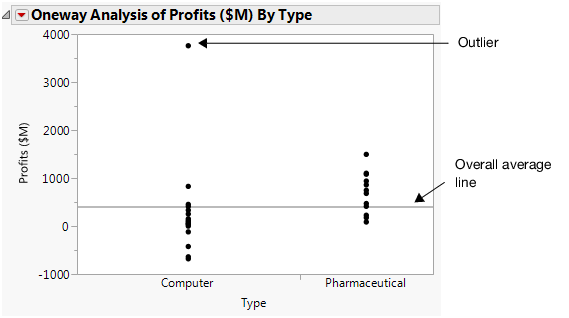
There is an outlier in the Computer Type. The outlier is stretching the scale of the plot and making it difficult to compare the profits. Exclude and hide the outlier:
1. Click the outlier.
2. Select Rows > Exclude/Unexclude. The data point is no longer included in calculations.
3. Select Rows > Hide/Unhide. The data point is hidden from all graphs.
4. To re-create the plot without the outlier, click the Oneway Analysis of Profits ($M) By Type and select Redo > Redo Analysis. You can close the original Scatterplot window.
Figure 5.16 Updated Plot
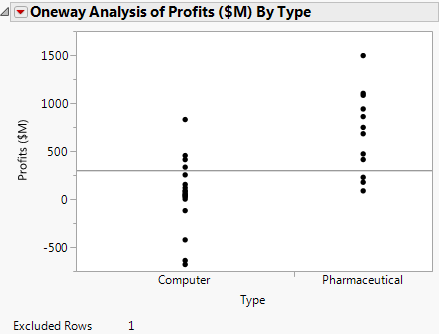
Removing the outlier gives the financial analyst a clearer picture of the data.
5. To continue analyzing the relationship, select these options from the red triangle next to Oneway Analysis of Profits ($M) By Type:
– Display Options > Mean Lines. This adds mean lines to the scatterplot.
– Means and Std Dev. This displays a report that provides averages and standard deviations.
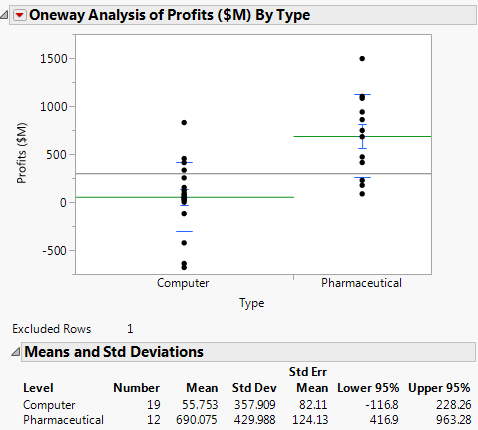
Figure 5.17 Mean Lines and Report
Interpret the Results
The financial analyst wanted to know how the profits of computer companies compared to the profits of pharmaceutical companies. The updated scatterplot shows that pharmaceutical companies have higher average profits than computer companies. In the report, if you subtract one mean value from the other, the difference in profit is about $635 million. The plot also shows that some of the computer companies have negative profits and all of the pharmaceutical companies have positive profits.
Perform the t Test
The financial analyst has looked at only a sample of companies (the companies in the data table). The financial analyst now wants to examine these questions:
• Does a difference exist in the broader population, or is the difference of $635 million due to chance?
• If there is a difference, what is it?
To answer these questions, perform a two-sample t test. A t test lets you use data from a sample to make inferences about the larger population.
To perform the t test, click the Oneway Analysis red triangle and select Means/Anova/Pooled t.
Figure 5.18 t Test Results
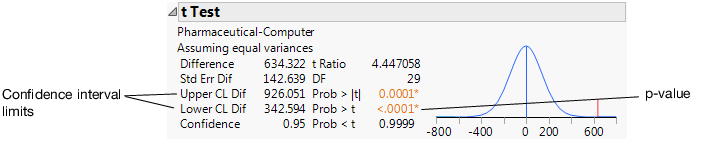
The p-value of 0.0001 is less than the significance level of 0.05, which indicates statistical significance. Therefore, the financial analyst can conclude that the difference in average profits for the sample data is not due to chance alone. This means that in the larger population, the average profits for pharmaceutical companies are different from the average profits for computer companies.
Draw Conclusions
Use the confidence interval limits to determine how much difference exists in the profits of both types of companies. Look at the Upper CL Dif and Lower CL Dif values in Figure 5.18. The financial analyst concludes that the average profit of pharmaceutical companies is between $343 million and $926 million higher than the average profit of computer companies.