Contour Specification
If you do not select options in the Launch window, the default plot spaces the contour levels equally within the range of the Y variable. You can specify a color theme by selecting a Continuous Color Theme in File > Preferences > Graphs. You can customize colors for individual contours by right-clicking on an item in the Contour Plot legend.
You can specify contour levels either in the Launch window (the Specify button) or in the report window from the red triangle menu for Contour Plot (the Specify Contours option).
Figure 10.7 Example of Contour Specification: Launch Window (on the left) and Menu (on the right)
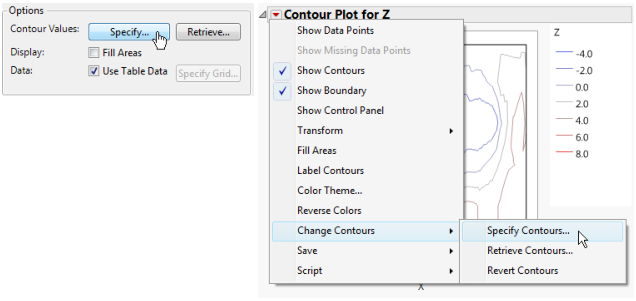
Specify
This option is both in the Launch window and on the red triangle menu for Contour Plot (the Specify Contours option).
Selecting this option displays the Contour Specification window (Figure 10.8). Using this window, you can do the following:
• change the number of contours
• specify minimum and maximum values to define the range of the response to be used in the plot
• change the increment between contour values
You supply any three of the four values, and the remaining value is computed for you. Click the check box to deselect one of the numbers and automatically select the remaining check box.
Figure 10.8 The Contour Specification Window
Colors are automatically assigned and are determined by the number of levels in the plot. After the plot appears, you can right-click (press CONTROL and click on macOS) on any contour in the plot legend and choose from the JMP color palette to change that contour color.
Retrieve
This option is both in the Launch window (the Retrieve button) and on the red triangle menu for Contour Plot (the Retrieve Contours option).
Note: Neither the button nor the menu option are active unless there is an open data table in addition to the table that has the contour plotting values. When you click Retrieve or select Retrieve Contours, a window with a list of open data tables appears.
Using this option, you can retrieve the following from an open JMP data table:
• the number of contours
• an exact value for each level
• a color for each level
From the list of open data tables, select the data table that contains the contour levels.
For level value specification, the Contour Plot platform looks for a numeric column with the same name as the response column that you specified in the Launch window. The number of rows in the data table defines the number of levels.
If there is a row state column with color information, those colors are used for the contour levels. Otherwise, the default platform colors are used.
Revert Contours
This option appears only on the red triangle menu for Contour Plot.
If you have specified your own contours, selecting this option reverts your Contour Plot back to the default contours.