Create a Web Report
The File > Publish option creates a web page in which reports, descriptive text, and graphics are displayed. The web page, graphics, and support files are saved in the directory that you specify so that you can zip the files and send them to another user. This feature is particularly helpful for non JMP users.
Some graphs can be displayed as interactive HTML (for example, bubble plots or background maps). When you click the thumbnail of the graph in a web report, the interactive graph appears on a new web page.
To generate a web report, follow these steps:
1. Select Help > Sample Data Library and open SATByYear.jmp.
2. Run the Graph Builder Map and Bubble Plot by State scripts.
3. From any JMP window, select File > Publish.
4. Click Select All to display both graphs in the report.
Publish to should be set to File, and the Publish Data box should be selected.
5. Click Choose and navigate to where you want to put the parent folder. Click Select Folder.
Note that the Name of sub-folder for this report box indicates the current date and time. The web report files are saved in this folder.
6. Click Next.
7. Enter SAT By Year Reports in the Web Report Title box.
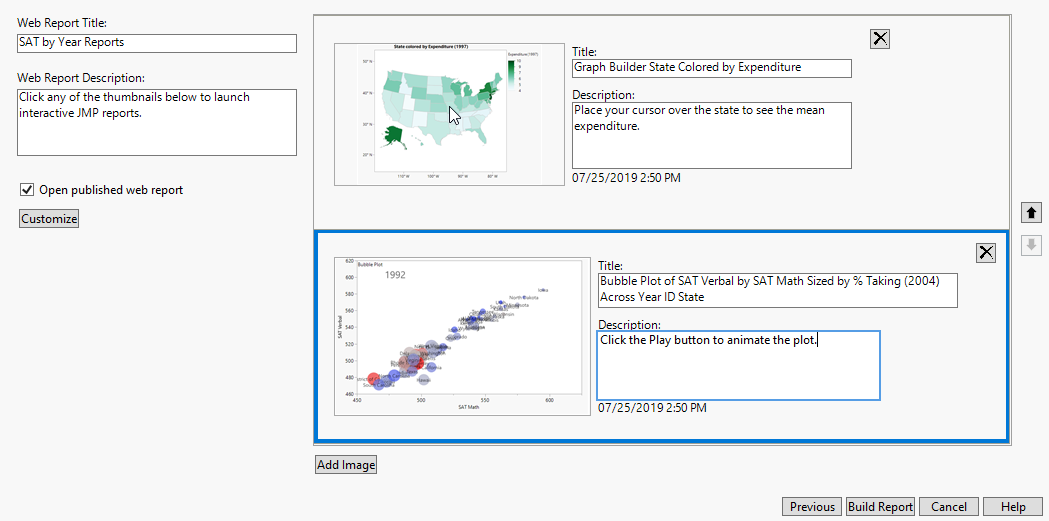
8. Enter the descriptions and titles as shown in Figure 10.3.
Note: If you selected one report, you have the option of generating an index page. The index page shows a thumbnail of the report. You click the thumbnail to view the report. Figure 10.4 shows an example.
Figure 10.3 Customizing the Web Report
Notes:
– The reports are in the order you created them. In this example, the Graph Builder Map script was run first, so the map is the first report. Use the arrows next to the reports to rearrange them. Also, after you remove a report, a Restore Reports button appears in case you want to add the report again.
– Click Add Image to append an image to the bottom of the report.
– Click Customize to find options for changing the font, logo, and more. See Web Report Options.
9. Click Build Report.
The web page opens in your default browser.
Figure 10.4 Web Report
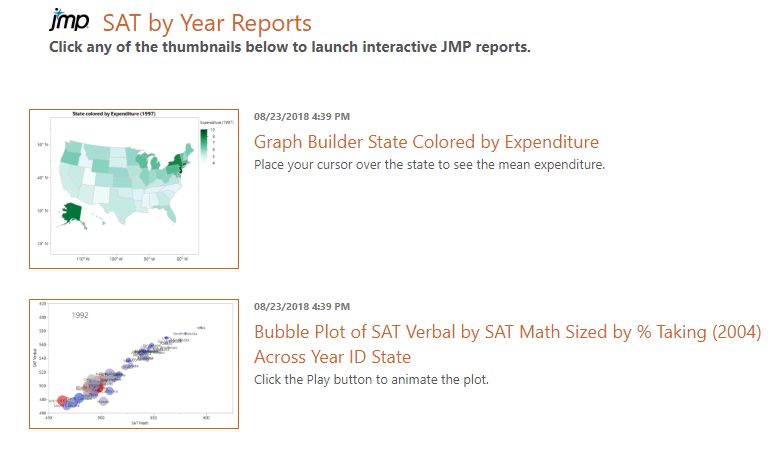
10. Click one of the thumbnails to open the report in an interactive web page.
For more information about working with interactive reports, from an HTML report, click ![]() > Help. This opens the help page: https://www.jmp.com/interactive.
> Help. This opens the help page: https://www.jmp.com/interactive.
Web Report Options
Style Format
Determines the layout of the reports.
Large List
Shows the reports in a column with large thumbnail graphics.
Small List
Shows the reports in a column with small thumbnail graphics.
Grid
Shows the reports in rows.
Custom CSS
Enables you to specify a CSS file to format the web page. The CSS file is copied into a subdirectory called _css. The link to the CSS file is relative so that you can send the report and support files to another user and maintain the CSS formatting.
Color Theme
Specifies the color of the web page, headings, and borders. The default web page has a white background, orange headings, and blue borders.
Change Font
Change the font applied in the reports.
Change Logo
Specifies an image to display along with the reports. Click the up or down arrow next to the image to move it above or below the reports.
Show date/time
Shows or hides the date and time at which the web page was generated.
Publish to JMP Public or JMP Live
JMP Live is a website purchased by your company for sharing JMP content privately, and can be hosted by SAS or your company. JMP Public is a website using the same technology as JMP Live, where anyone can share JMP content with the public.
JMP Public and JMP Live are platforms for sharing JMP data, visualizations and dashboards. Prepare your reports in JMP and publish them as posts to collaborate with your colleagues, even those who might not have JMP.
JMP Public and JMP Live offer the visual interactivity of JMP to explore your data, and let you:
• Store all of your reports in one location.
• Control sharing of individual reports with those who need to see them.
• Maintain up-to-date reports for your team in an easily accessible location.
• Extend the functionality of reports to other locations – embed and interact with your reports in web pages, blogs, social media posts and more.
Register and edit your profile (JMP Public Only)
If you are not signed in to JMP Public, you see only featured posts. Before you can publish posts, you need to register and sign in.
1. In a Chrome browser, go to https://public.jmp.com.
2. At the top right, click Sign in.
3. If you already have a SAS profile, log on using those credentials, then click Submit.
4. If you do not have a SAS profile:
b. Click Register. Complete the form and click Create profile.
c. Follow the instructions in the email to set your password and activate your profile.
5. (Optional) To change your profile name or picture, once you are signed in to JMP Public, click your name and select My Profile > Edit.
Create and publish a report
1. In JMP, create a report, or several reports that you want to share.
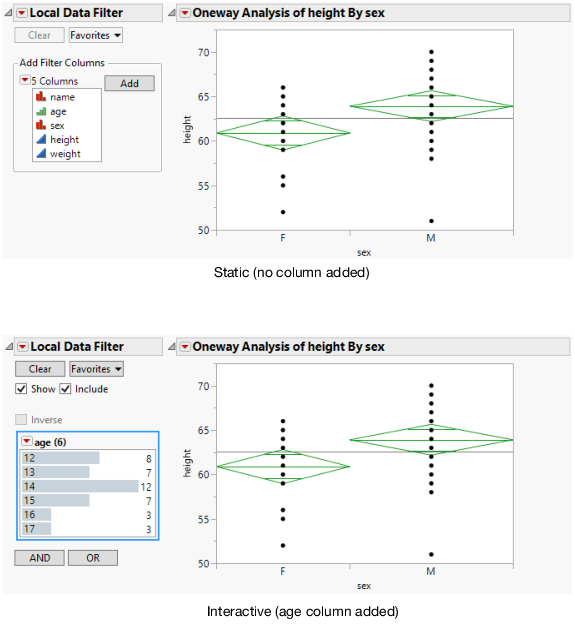
2. (Skip if your report does not contain a Local Data Filter.) If your report contains a Local Data Filter, add columns before you publish. This means you must select a column or columns in the Local Data Filter and click Add.
You will not be able to add filter columns after you publish the report. It will simply be static instead of interactive. See Figure 10.5.
Figure 10.5 Static and Interactive Local Data Filters
3. From a report window, select File > Publish.
4. Check the box next to the reports that you want to share, or click Select All.
Figure 10.6 Select Reports Window
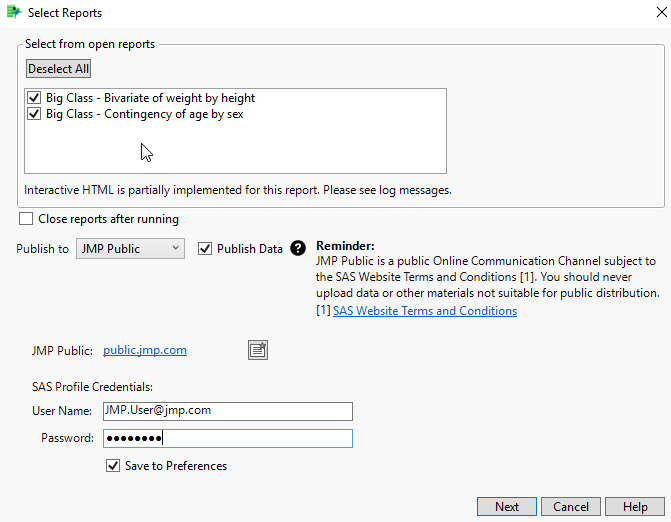
5. Next to Publish to, select JMP Public or JMP Live.
Note: If you do not see JMP Live, your administrator might have changed the bookmark name. Check with your administrator.
6. (Optional, JMP Live only) If the JMP Live box is active, you can save (bookmark) or change the server name:
a. To change the server name, click in the JMP Live box and enter a new name.
b. To save the server name as an option under Publish to, create a bookmark. Click ![]() .
.
c. Enter a name that will appear under Publish to. Click OK.
7. (Optional) To publish the data tables associated with the reports and make the reports interactive, Publish Data should be selected. If you deselect this, data are not embedded and the graphs are static.
8. Enter your User Name and Password.
9. (Optional) To remember your credentials, check Save to Preferences.
10. Click Next.
Figure 10.7 Configure the Web Report
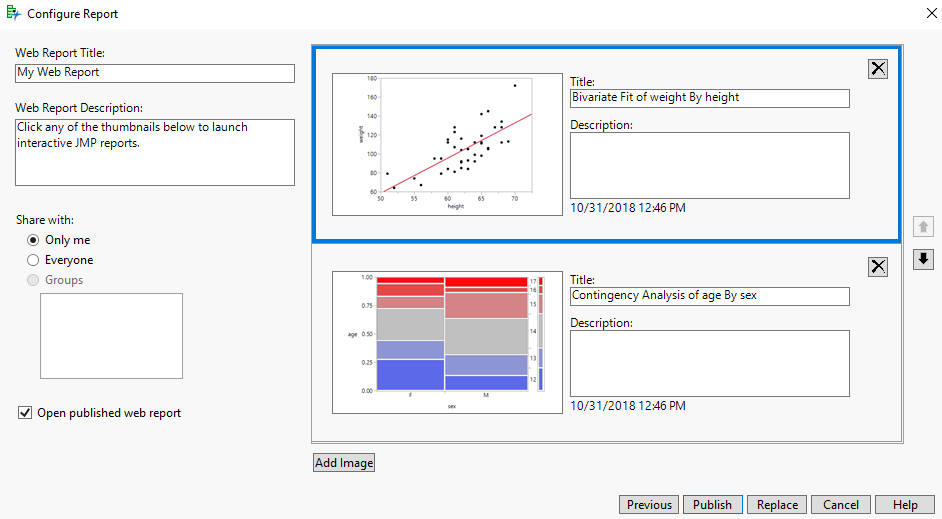
11. (Multiple reports only) At left, enter a title and optionally, a description for your overall post. You can also:
– Change the order of the individual reports by clicking the arrows  on the right.
– Delete a report by clicking  .
.
12. On the right, enter a title and optionally, a description for each report.
13. (Optional) To open the post after creating it, check Open published web report.
14. Choose who to share with: Only Me, Everyone, or Groups:
– Only Me means your report is visible to you only. An orange lock icon appears on the report in JMP Public or JMP Live to indicate that it is private.
Note: If you choose Only Me, you are prompted to log in to confirm your identity before the post opens.
– To share your report with everyone on JMP Public or JMP Live, choose Everyone.
– To share your report with a group or groups, choose Groups and select the groups you want to share the report with.
15. (Optional, multiple reports only) To add images, click Add Image. You can also enter a title and description.
16. Click Publish. Or, if you are updating an existing post, click Replace. When replacing a post, make sure that the titles match.
17. (Appears first time and for JMP Public only) Read the alert, click I understand and agree, then click Yes.
18. Click OK to dismiss the informative window that says your reports are published.
The post opens in your default browser.
For help using JMP Public or JMP Live, click  > Help. This opens one of these help pages:
• JMP Public: https://www.jmp.com/jmppublic
• JMP Live: https://www.jmp.com/jmplive
• JMP Live (administrator): https://www.jmp.com/jmpliveadmin