Create the Design
Create the design following the steps in the design workflow process outlined in The DOE Workflow: Describe, Specify, Design:
• Define Responses and Factors
Define Responses and Factors
In the first outlines that appear, enter information about your response and factors.
Responses
1. Select DOE > Custom Design.
2. Double-click Y under Response Name and type Strength.
Note that the default Goal is Maximize. Your goal is to find factor settings that enable you to brew coffee with a target strength of 1.3, within limits of 1.2 and 1.4.
3. Click the default Goal of Maximize and change it to Match Target.
Figure 3.4 Selection of Match Target as the Goal
4. Click under Lower Limit and type 1.2.
5. Click under Upper Limit and type 1.4.
6. Leave the area under Importance blank.
Because there is only one response, that response is given Importance 1 by default.
The completed Responses outline appears in Figure 3.5.
Factors
Enter factors either manually or from a pre-existing table that contains the factors and settings. If you are designing a new experiment, you must first enter the factors manually. Once you have saved the factors to a data table using the Save Factors option, you can load them using the saved table.
For this example, you can choose either option. See Entering Factors Manually or see Entering Factors Using Load Factors.
Entering Factors Manually
1. Click Add Factor > Categorical > 2 Level.
2. Type Grind over the default Name of X1.
Note that Role is set to Categorical, as requested. The Changes attribute is set to Easy by default, indicating that Grind settings can be reset for every run.
3. Click the default Values, L1 and L2, and change them to Coarse and Medium.
4. Type 3 next to Add N Factors. Then click Add Factor > Continuous.
5. Type the following names and values over the default entries:
– Temperature (195 and 205)
– Time (3 and 4)
– Charge (1.6 and 2.4)
6. Click Add Factor > Blocking > 4 runs per block.
Recall that your run budget allows for 12 runs. You want to balance these runs among the three stations.
7. Type Station over the default Name of X5.
Notice that Role is set to Blocking and that only one setting for Values appears. This is because JMP cannot determine the number of blocks until the desired number of runs is specified. Once you specify the Number of Runs in the Design Generation outline, JMP updates the number of levels for Station to what is required.
Figure 3.5 Completed Responses and Factors Outlines
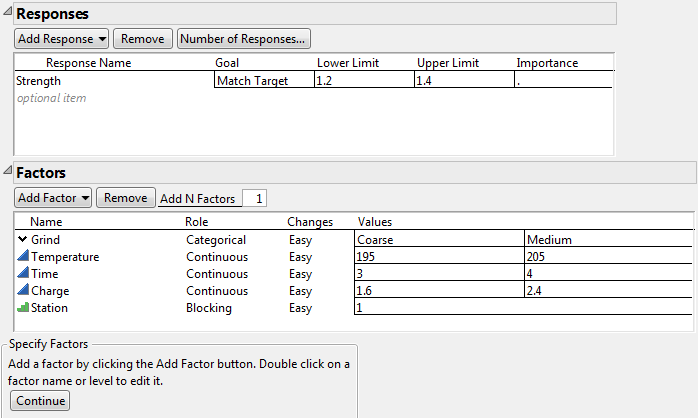
8. Click Continue.
The following outlines are added to the Custom Design window:
– Define Factor Constraints (not used in this example)
– Model
– Alias Terms
– Design Generation
Entering Factors Using Load Factors
To enter factors using a table containing factor information, proceed as follows:
1. Click the Custom Design red triangle and select Load Factors.
2. Select Help > Sample Data Library and open Design Experiment/Coffee Factors.jmp.
After loading the factors, the Custom Design window is updated. The following outlines are added to the Custom Design window:
– Define Factor Constraints (not used in this example)
– Model
– Alias Terms
– Design Generation
Define Factor Constraints
The Define Factor Constraints outline appears once you have entered your factors manually and clicked Continue, or once you have loaded the factors from the factor table. Adding factor constraints, if you have any, is part of the Responses and Factors step. Since there are no constraints on factor settings for this design, leave this outline unchanged.
Specify the Model
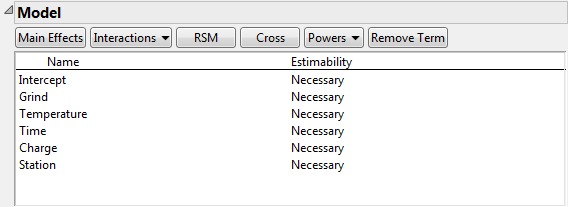
Model Outline
Figure 3.7 shows the Model outline. The Model outline is where you specify your assumed model, which contains the effects that you want to estimate. See Specify. The list that appears by default shows all main effects as Necessary, indicating that the design is capable of estimating all main effects. Because your main interest at this point is in the main effects of the factors, you do not add any effects to the Model outline.
Figure 3.6 Model Outline with Main Effects Only
Steps to Duplicate Results (Optional)
Because the Custom Design algorithm begins with a random starting design, your design might differ from the one shown in Figure 3.8. To obtain a design with exactly the same runs, perform the following steps before generating your design:
1. Click the Custom Design red triangle and select Set Random Seed.
2. Type 569534903.
3. Click OK.
4. Click the Custom Design red triangle and select Number of Starts.
5. Type 100.
6. Click OK.
Note: Setting the Random Seed and Number of Starts reproduces the exact design shown in this example. However, the rows in the design table might be in a different order. In constructing a design on your own, these steps are not necessary.
Generate the Design
In the Design Generation outline, you can enter additional details about the structure and size of your design. The Default design is shown as having 12 runs. Recall that your design budget allows for 12 runs (Number of Runs).
Figure 3.7 Design Generation Outline
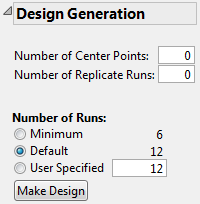
1. Click Make Design.
The Design and Design Evaluation outlines are added to the Custom Design window. The Output Options panel also appears.
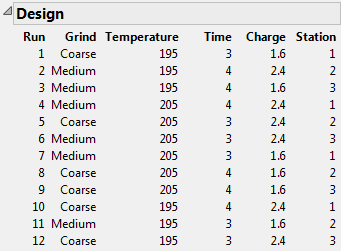
The Design outline shows the design (Figure 3.8). If you did not follow the steps in Steps to Duplicate Results (Optional), your design might be different from the one in Figure 3.8. This is because the algorithm begins with a random starting design.
Figure 3.8 Design for Coffee Experiment
Evaluate the Design
The Design Evaluation outline provides various ways to evaluate your design. This is an important topic, but for simplicity, it is not covered in the context of this example. See Evaluate Designs.
Make the Table
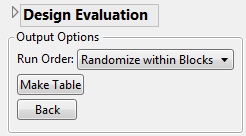
Specify the order of runs in your data table using the Output Options panel. The default selection, Randomize within Blocks, is appropriate. This selection arranges the runs in a random order for each Station.
Figure 3.9 Output Options
1. Click Make Table.
The data table shown in Figure 3.10 opens. Keep in mind that, if you did not follow the steps in Steps to Duplicate Results (Optional), your design table might be different. Your design table represents another optimal design.
Figure 3.10 Custom Design Table
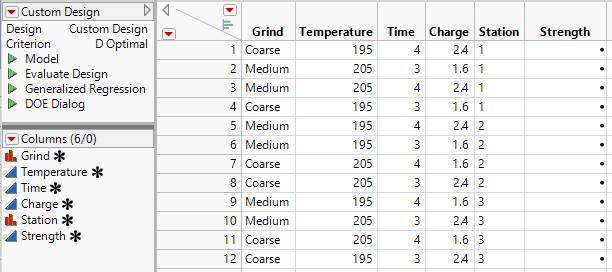
Note the asterisks in the Columns panel to the right of the factors and response. These indicate column properties that have been saved to the columns in the data table. These column properties are used in the analysis of the data. See Factors and Factor Column Properties.