Debugger and Profiler Window
The Debugger opens in a new instance of JMP (Figure 4.10). The original instance is inoperable until the script produces something that requires interaction. At that point, the Debugger window becomes inoperable until you perform whatever action is required. Then control is returned to the Debugger. Close the Debugger to work again in the original instance of JMP.
Figure 4.10 The Debugger Window
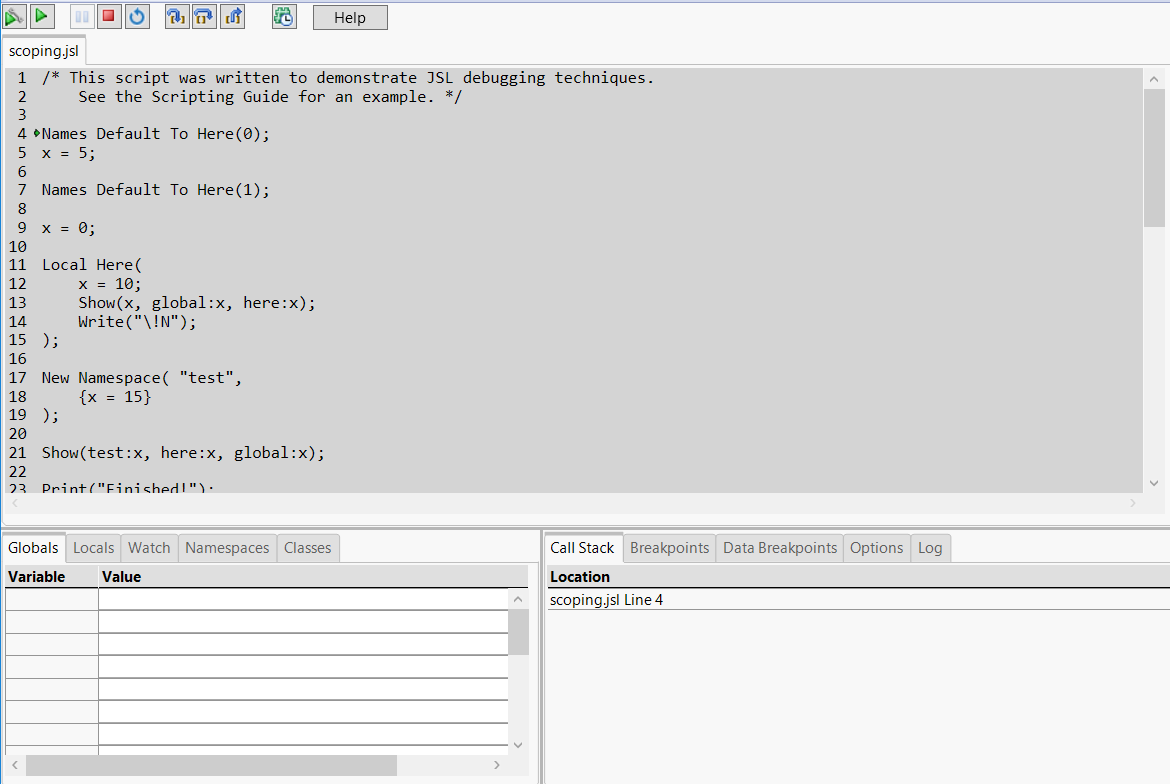
Use the buttons at the top to control the Debugger or the JSL Profiler. One or more scripts that you are debugging or profiling are shown in tabs. If your script includes other scripts, each one opens in a new tab.
Tabs in the bottom portion of the Debugger provide options to view variables, namespaces, the log, and the current execution point; work with breakpoints; and set options.
Tip: To view or edit long values on a tab in the Debugger, right-click the value and select Edit. The code opens in a script editor.
Using the Execution Buttons
Use the buttons at the top to control execution of the script within the Debugger or JSL Profiler.
Button | Button Name | Action |
|---|---|---|
| Run | Runs the script in the Debugger until it reaches either a breakpoint or the end of the script. Note: If there is an error in the script, an abbreviated error message is displayed at the top of the window. Click More to see the complete error message. |
| Run without breakpoints Run profiler | Runs the script through the end without stopping. |
| Break All | If the script is busy, click Break All to stop all action in the script and return to the Debugger or JSL Profiler, for example, if you are in a very long loop. The Debugger or JSL Profiler may not be able to break execution if the executing script is waiting on some interactive user action, such as completing a dialog or interacting with an opened window. |
| Stop | Stops debugging the script and exits the Debugger or the JSL Profiler. |
| Restart | Closes the current Debugger session and opens a new session. |
| Step Into | Lets you step into a function or an included file. Otherwise, it behaves the same as Step Over. |
| Step Over | Runs all expressions on a single line, or a complex expression that spans multiple lines, without stepping into a called expression, function, or Include() file. |
| Step Out | Runs the current script or function to a breakpoint or the end and returns to the calling point. If you are in the main script and the Debugger reaches the end, a message appears: Program execution terminated. The Debugger remains open in order for you to inspect the final program conditions. |
| Profile JSL Script | Opens the JSL Profiler. (Press the Run profiler button to start the JSL Profiler.) Use the JSL Profiler to see how much time is spent executing particular lines or how many times a particular line is executed. Notes: • You can switch back and forth between the Debugger and JSL Profiler modes only prior to the start of the program. • Some of the debugger buttons are disabled when profiling. • All breakpoints are disabled when running in the JSL Profiler mode. |
| Show Profile by Line Count | Shows the number of times each line is executed. |
| Show Profile by Time | Shows how much time is spent executing a line. |
| Show Profile by Count | For line counts, shows the number of times the line is executed. For time, shows the number of microseconds (or milliseconds or seconds) the line takes to complete. |
| Show Profile by Percent | For line counts, shows the individual line count divided by the total line count. For time, shows the percentage of time spent on an individual line (line time/total time*100). |
| Time Units | Sets the time unit to microseconds, milliseconds, or seconds. Available in the JSL Profiler after you click the Run profiler button |
| Color Theme | Sets the color of the shading for the JSL Profiler. Available in the JSL Profiler after you click the Run profiler button |


Variable Lists
The tabs on the bottom left of the Debugger let you examine global variables, local variables, watch variables, and variables within namespaces.
Globals
The Globals tab lists all global variables and updates their values as you step through the script. Each variable is added as it is initialized. If there are already global variables defined from running earlier scripts, they will be listed with their current values when you start the Debugger. See View Variables.
Locals
The Locals tab lists all variables by scope and updates their values as you step through the script. Select a scope in the menu. See View Variables.
Watch
If there is a particular variable or value of an expression whose values you want to watch as you step through the code, you can add them here. This is particularly useful if your script uses many variables that might be hard to watch in the Globals or Locals lists. See Work with Watches.
Namespaces
As namespaces are defined, they are added to the menu. Select a namespace to view any variables and their values used within the namespace. See View Variables.
Classes
The Classes tab lists classes that are defined in the script. See Classes in the Programming Methods section.
Debugger Options
The tabs on the bottom right of the Debugger let you view the call stack, work with breakpoints, set options, and view the log.
Call Stack
The call stack lists the current execution point in scripts and functions. The main script is always the first script listed. If you call a function, the function is added on top of the calling script. Likewise, any included files are added to the top of the list as you step through them. When you exit any function or script, it is removed from the list and you return to the next one in the list. The current line numbers are updated as you step through.
Double-click a row in the call stack to move the cursor to the specified line.
Breakpoints
Add, edit, delete, and disable or enable breakpoints on lines. See Work with Breakpoints. You can also double-click a row on the Breakpoints tab to move the cursor to the specified line.
Data Breakpoints
Add, edit, delete, and disable or enable breakpoints in variables. Data breakpoints watch for changes in variables, unlike breakpoints, which watch for changes in lines.
Options
Set the Debugger preferences interactively on this tab. See Modify Preferences in Debugger.
Log
The log from the script that you are debugging is shown on this tab.