Design
The Design outline shows the runs for a design that is optimal, given your selections. Review the design to ensure that it meets your needs.
Figure 18.20 Design Outline for Coffee Example
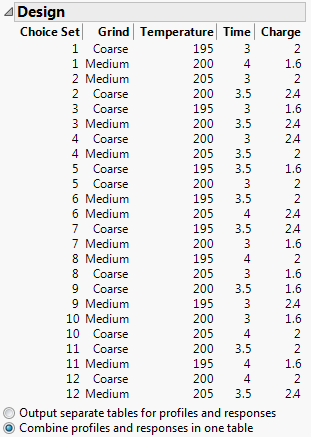
Note: Figure 18.20 is taken from the coffee example. See Example of a Choice Design.
Note: The algorithm for finding an optimal design is based on a random starting design. Because of this, the design you obtain is not unique. The design algorithm will generate different designs when you click the Back and Make Design buttons repeatedly.
Output Options
Select one of the following output options:
Output separate tables for profiles and responses
Displays two data tables:
– The Choice Profiles table lists the profiles in each row, identified by Survey and Choice Set columns. Within a choice set, the profiles are identified by Choice ID. This table is useful for constructing the survey instruments.
– The Choice Runs table provides an empty Response column where you can enter respondent preferences. Each row corresponds to a single choice set. The rows are sorted by Respondent, Survey, and Choice Set. The choice set IDs are given in the next columns, followed by the Response column. Enter the choice set ID for the respondent’s preference in the Response column.
Combine profiles and responses in one table
Provides a single Choice Profiles table with an empty Response Indicator column where you can enter respondent preferences. Each row corresponds to a single profile. The table is sorted by Respondent, Survey, and Choice Set. Enter the value 1 (or another nonzero numerical indicator) for the respondent’s preferred profile and a 0 indicator for the other profiles in that choice set.
Note: The values you enter in the Response Indicator column must be numerical.