Example of a Mosaic Plot
In this example, you are interested in whether there is a relationship between the time of day and the activity of dolphins. Your data consist of Activity and Period (time of day) combinations, and the numbers of Groups of dolphins observed for each combination. Notice that Groups is a frequency column.
1. Select Help > Sample Data Library and open Dolphins.jmp.
2. Select Graph > Graph Builder.
3. Select Period and drag it to the X zone.
4. Select Activity and drag it to the Y zone.
5. Select Groups and drag it to the Freq zone.
6. Click the Mosaic element ![]() .
.
7. (Optional) Click Done.
Figure 4.42 Mosaic Plot for Dolphin Activity
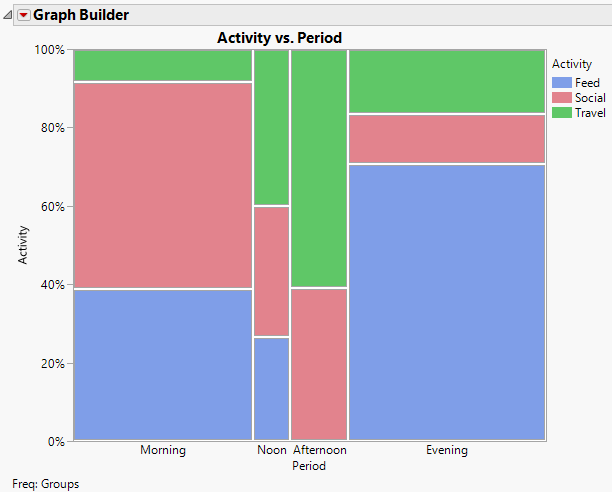
You can draw many conclusions from this graph. For example, the largest numbers of groups were observed in the morning or evening. There was proportionately more feeding activity in the evening than at any other time of day. No groups were observed feeding in the afternoon. Social behavior tended to occur in the morning.