Publication date: 07/30/2020
Graph Builder Examples
Visualize Data Interactively
Graph Builder provides you with a variety of flexible ways to explore your data. This chapter shows examples of examining data using contour plots, bar charts, histograms, area plots, treemaps, and other types of plots.
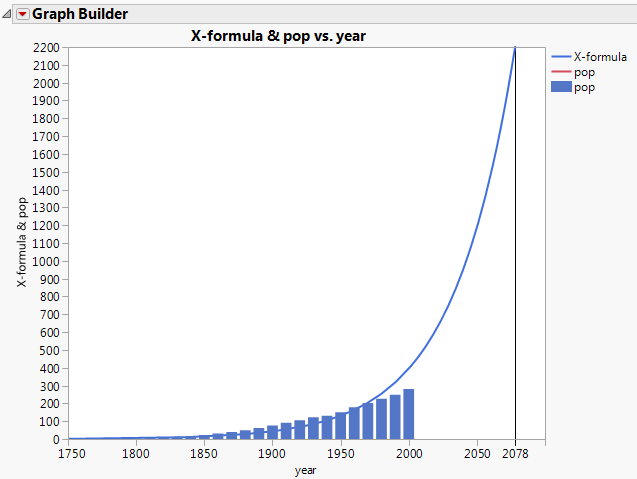
Figure 4.1 Example Using a Formula, Bars, and a Reference Line
Contents
Example of a Contour Plot
Example of a Contour Plot with a Color Variable
Example of a Violin Plot
Example of a Stacked Bar Chart
Example of a Packed Bar Chart
Example of Custom Error Bars
Examples of Area Plots
Show Behavior over Time
Show Bounds around Group Means
Example of Overlaying Histograms with Transparency
Example of Wafer Maps Based on a Cluster Analysis
Example Using a Heatmap to Apply Background Colors
Example of a Treemap
Example of a Mosaic Plot
Example Using a Formula
Example Using Images as Markers
Want more information? Have questions? Get answers in the JMP User Community (community.jmp.com).