Example of Custom Error Bars
You have conducted an experiment to study popcorn yield. The factors that you studied are popcorn type (plain or gourmet), how much oil was used, and the batch size (small or large). The response is the yield. You want to determine how the factors popcorn type, oil, and batch size affect the popcorn yield.
There are eight possible factor level combinations and each combination is tested twice, resulting in 16 values for yield.
Note: These data are artificial, but inspired from an experiment reported in Box, Hunter, and Hunter (1978).
1. Select Help > Sample Data Library and open Popcorn.jmp.
2. In the Tables panel at top left, click the green triangle next to Full Factorial Model.
A full factorial model is fit to the data.
Figure 4.14 Effect Summary Report
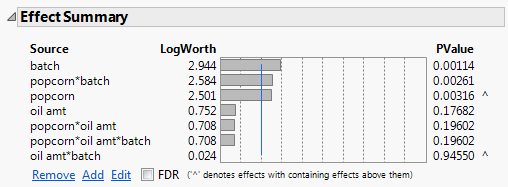
In the Effect Summary report, notice that the popcorn*batch interaction has a small p-value (0.00261). From this, you conclude that there is a significant interaction between popcorn and batch.
3. Click the Response yield red triangle and select Save Columns > Prediction Formula.
This saves a column that contains the prediction formula to the data table. The new column is Pred Formula yield.
4. Click the Response yield red triangle and select Save Columns > Mean Confidence Interval.
This adds two new columns to the data table: Lower 95% Mean yield and Upper 95% Mean yield.
Now you can use Graph Builder to visualize the interaction between popcorn and batch.
5. Select Graph > Graph Builder.
6. Select these columns and drag them to the Y zone:
– Pred Formula yield
– Lower 95% Mean yield
– Upper 95% Mean yield
7. Select popcorn and drag it to the X zone.
8. Select batch and drag it to the Group X zone.
9. Select oil amt and drag it to the Group Y zone.
Figure 4.15 Yield Values for the Eight Factor Combinations
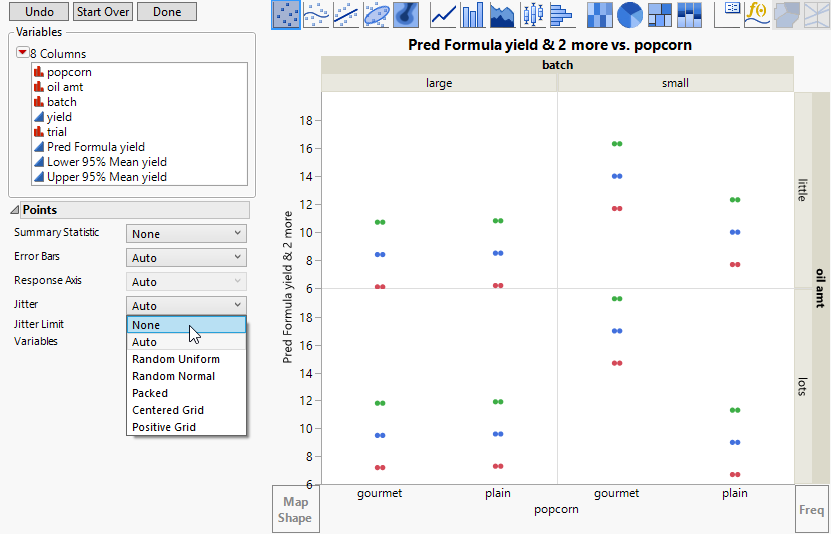
Recall that there are two observations at each of eight possible combinations of factors levels. The prediction formula gives the same prediction for each of the two sets of identical factor level combinations. Because the Jitter option is selected, you see two points for each combination of popcorn, batch, and oil amt.
10. Change Jitter to None (Figure 4.15).
Format the graph to see interval bars for Lower 95% Mean yield and Upper 95% Mean yield, and to see points for Pred Formula yield.
11. Select the Bar element  and drag it to the plot.
This adds bars for all three Y-axis variables.
Figure 4.16 Confidence Limits and Means Plotted as Side-by-Side Bars
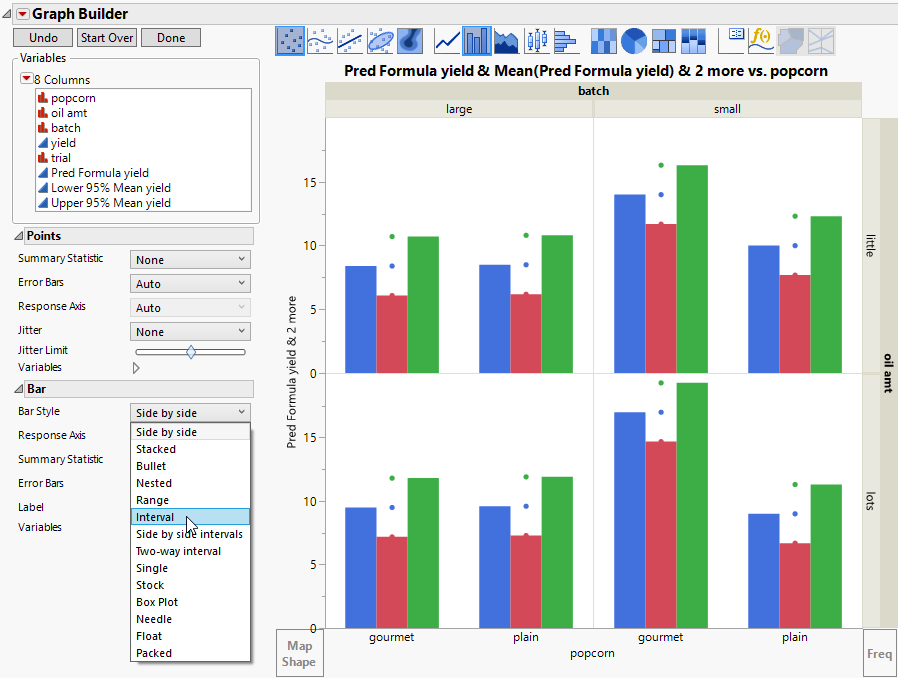
12. In the Bar options panel, select Interval from the Bar Style menu (Figure 4.16).
Figure 4.17 Interval Bar Style Applied to Three-Y-Axis Variables
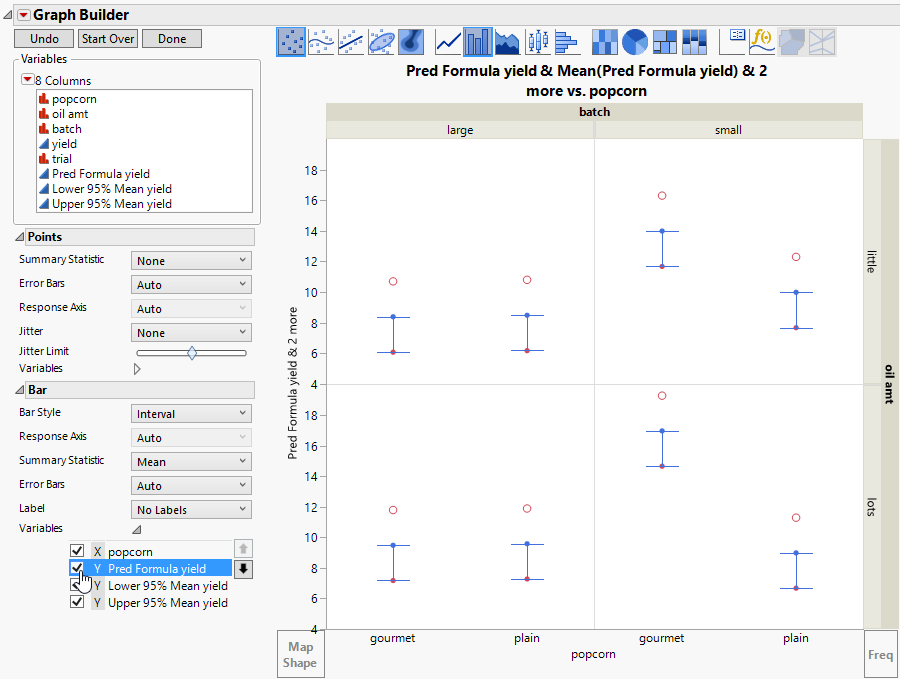
The interval bar style currently spans from Lower 95% Mean yield to Pred Formula yield, but you want it to span up to Upper 95% Mean yield. Remove the bar element for Pred Formula yield.
13. In the Bar options under Variables, deselect Y Pred Formula yield (Figure 4.17.)
Now the confidence intervals span from their lower to upper values.
Figure 4.18 Interval Span for Confidence Boundaries
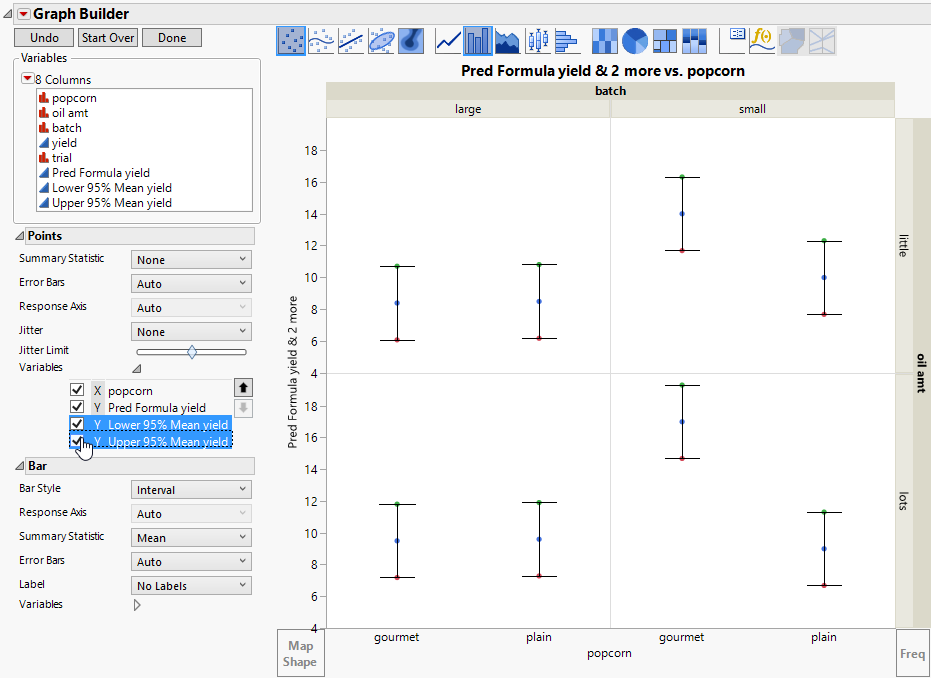
Remove the point graph element for Lower 95% Mean yield and Upper 95% Mean yield.
14. In the Points options under Variables, deselect Y Lower 95% Mean yield and Y Upper 95% Mean yield (Figure 4.18).
To make the predicted values easier to see, increase the size of the points.
15. Hold down the Ctrl key and right-click in any quadrant. Select Graph > Marker Size > XXL.
Tip: You can also change the graph title and labels for the X and Y zones. Click the label and type in the new text.
16. (Optional) Click Done.
Figure 4.19 Predicted Means and Confidence Intervals
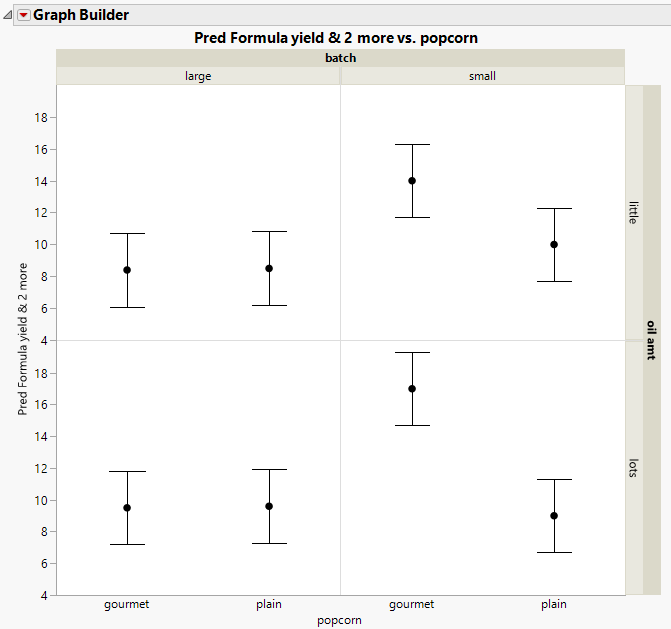
You can see the following relationships:
• For large batches, there is no difference between plain and gourmet popcorn.
• For small batches, the gourmet popcorn has a higher yield than the plain popcorn.
• For each level of oil amount, the relationship between popcorn type and batch size is the same. There is no evidence of a three-way interaction, as you would expect, since the Effect Summary report indicates that the three-way interaction is not statistically significant.