Example of a Treemap
In this example, you are interested in comparing the population of various states by region.
1. Select Help > Sample Data Library and open Cities.jmp.
2. Select Graph > Graph Builder.
3. Select State and drag it to the X zone.
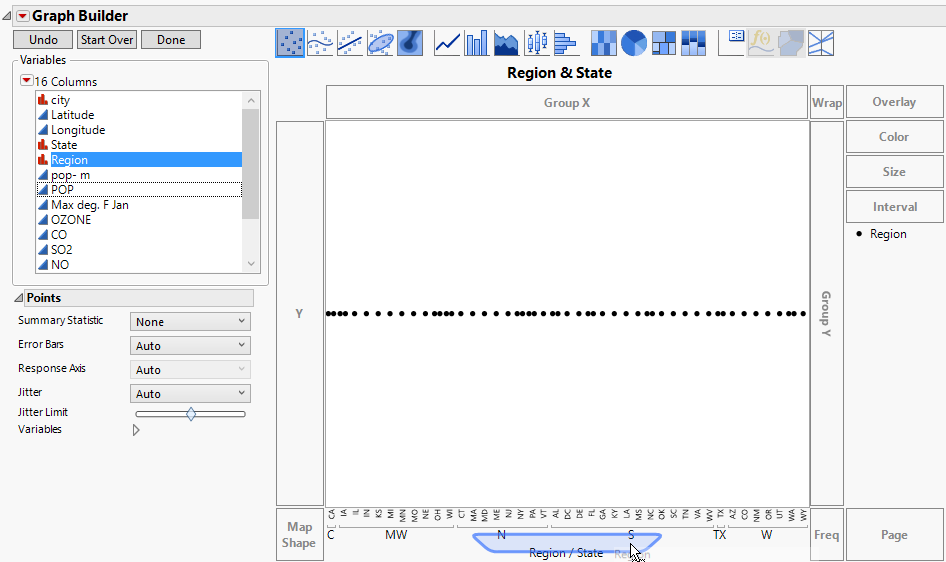
4. Select Region and merge it into the X zone.
This makes Region a supercategory, so that states are grouped within Region.
Figure 4.40 Region Merged with State
5. Select POP and drag it to the Y zone.
6. Click the Treemap element ![]() .
.
7. Select Region and drag it to the Color zone.
8. Under the Treemap options, check the box next to Size Value.
The Summary Statistic is set to Sum by default. This means that the rectangles are sized according to the sum of the population values in the cities within each state and region. According to this criterion, the most populated states within each region have the largest rectangles. The rectangle sizes for the regions also show their relative sizes in terms of population.
9. (Optional) Click Done.
Figure 4.41 City Populations by State Grouped within Region
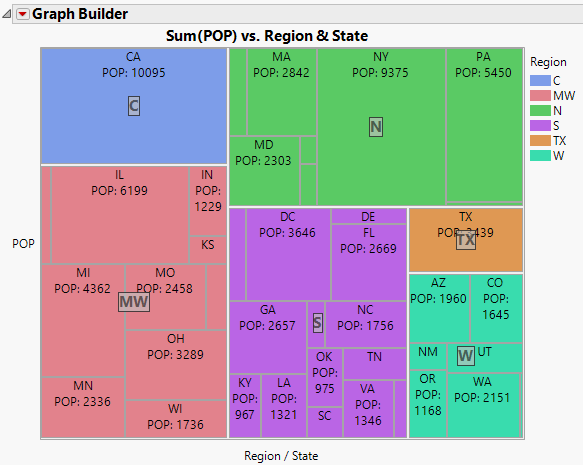
You can easily compare the population of each state according to region.
Tip: To deselect a Tree Map selection, use control-click (Windows) or command-click (macOS).