Show Bounds around Group Means
You are interested in how the height of teenagers varies by age. In this example, you use the Area element to show upper and lower bounds. You use custom transformations to create virtual columns, and virtual columns to create a graph.
Create Formula Columns Using Transform
To create upper and lower bounds for height by age group, use the Formula option.
• Define your upper bound to be the standard deviation within an age group added to the mean of that age group.
• Define the lower bound to be the standard deviation within an age group subtracted from the mean of that age group.
Create the Upper Bound for Height
1. Select Help > Sample Data Library and open Big Class.jmp.
2. Select Graph > Graph Builder.
3. Right-click the column height and select Formula.
4. Select Statistical > Col Mean.
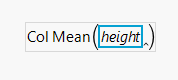
5. In the formula, click height so that the blue box is around only the variable name.
Figure 4.25 Select the height Variable
6. Enter a comma, and a byVariable box appears. Click age.
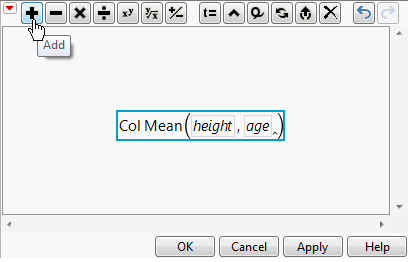
7. In the formula, select the outer box and click the plus sign.
Figure 4.26 Click the Plus Sign
8. Click Statistical > Col Std Dev.
9. Click height.
10. Enter a comma and a byVariable box appears. Click age.
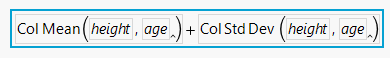
Your formula for the upper bound should look like Figure 4.27.
Figure 4.27 Formula for Upper Bound
11. Select the entire formula, right-click the outer box, and select Copy.
12. Click OK.
13. In the Variables list, right-click the Transform[height] column and select Rename.
14. Type upper and click OK.
Create the Lower Bound for Height
1. In the Variables list, right-click the column height and select Formula.
2. In the formula, right-click height and select Paste.
The formula that you created for the upper bound appears.
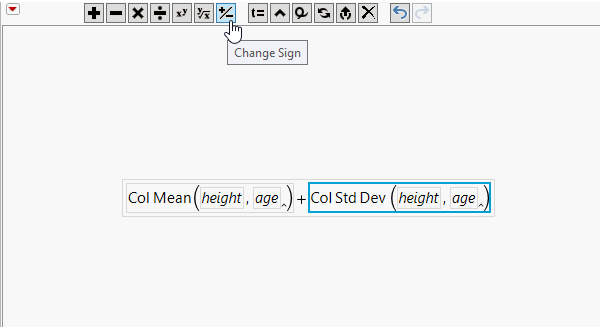
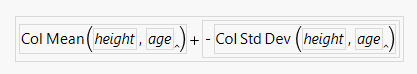
3. Select the box around Col Std Dev (height, age) and click the +/- sign.
Figure 4.28 Selecting Col Std Dev and Making It Negative
Your formula for the lower bound should look like Figure 4.29.
Figure 4.29 Formula for Lower Bound
4. Click OK.
5. In the Variables list, right-click the Transform[height] column and select Rename.
6. Type lower and click OK.
Build Graph
Using a combination of elements in Graph Builder, you can create a line graph of the mean height by age group, with shading to indicate the upper and lower bounds.
1. Select age and drag it to the X zone.
2. Select height, upper, and lower and drag them to the Y zone.
3. Click the Area element ![]() .
.
4. In the Area options, change the Area Style to Range.
5. In the Area options, click the triangle next to Variables. De-select Y height.
Figure 4.30 Area Plot
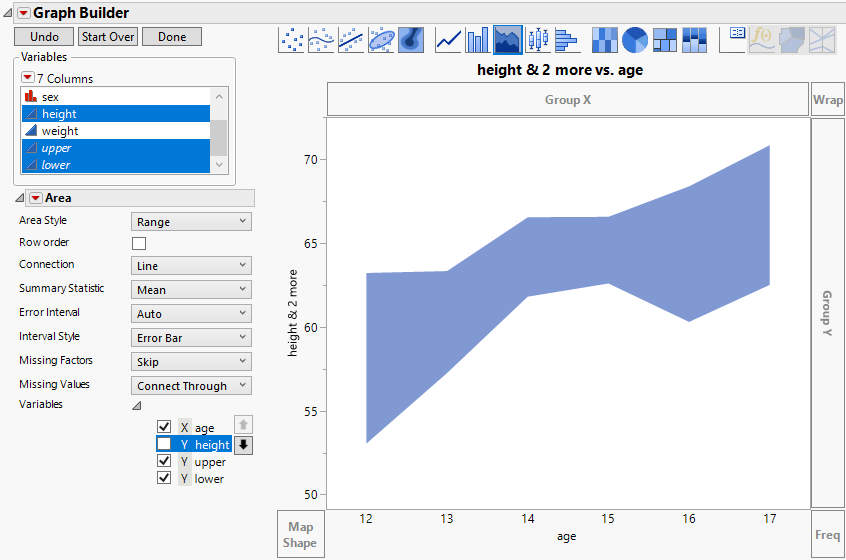
The shading indicates the range between the lower bound and upper bound for each age group. However, as is, you cannot see the means are for each group.
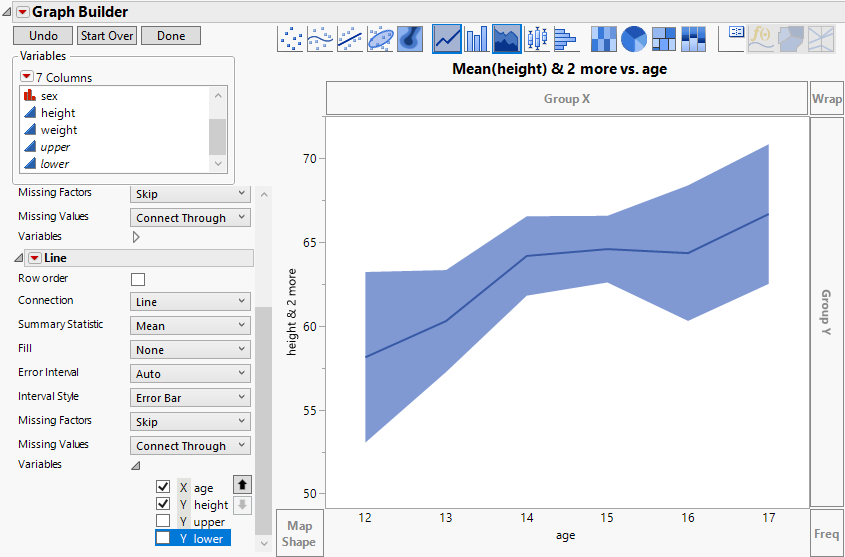
6. Press Ctrl and drag the Line element ![]() , into the graph.
, into the graph.
7. In the Line options, click the triangle next to Variables. De-select Y upper and Y lower.
Figure 4.31 Area Plot with Mean Line
8. (Optional) Click Done.
The dark blue line connects the mean heights for each age group. As expected, height tends to increase as age increases. The shaded area shows a range of one standard deviation above and one standard deviation below the mean height at each age group.