Example of a Multiple Response with Nonresponse
This example uses the Color Preference Survey.jmp sample data table, which contains survey data about people’s color preferences. You can use the Categorical platform to summarize results from a multiple response question with nonresponses. A nonresponse is a participant who did not answer the question. Surveys often use “none of the above” or “not applicable” as a response choice. This provides a method for distinguishing responders who do not see an appropriate response from those who did not answer the question.
1. Select Help > Sample Data Library and open Color Preference Survey.jmp.
2. Select Analyze > Consumer Research > Categorical.
3. Click the Structured tab.
4. Select What colors do you like? (with nonresponse) and drag it to the green arrow drop zone at the Side of the table.
Note: This column contains multiple response data where the response levels are delimited with commas. There are three rows that contain no responses. This column was constructed for this example and does not align with the responses in the individual “What colors do you like” columns.
5. Click the Top green arrow and select What is your gender?
6. Click Add=>.
7. Click OK.
Figure 3.44 Initial Cross Tabulation
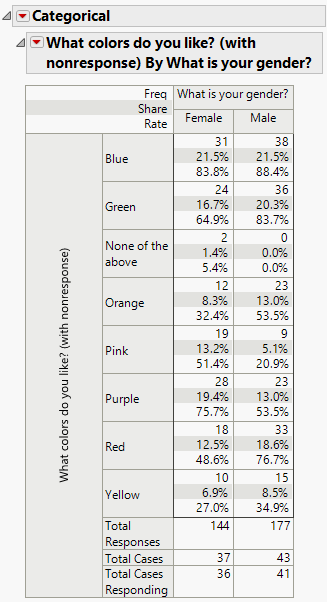
Note that the number of total cases is higher than the number of total cases responding. There are 37 Females who filled out the survey but only 36 responded to this question.
8. Click the Categorical red triangle and select Test Multiple Responses > Exclude Nonresponses.
9. Click the Categorical red triangle and select Test Multiple Responses > Homogeneity Test, Binomial.
Figure 3.45 Binomial Homogeneity Test Results
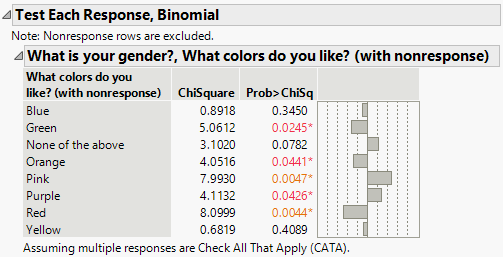
The analysis supports that blue and yellow have similar preference levels across genders while other colors tend to be favored more or less across genders. For example, Red appears to be liked more by males than by females. The p-value for the test is 0.0044, which supports a conclusion that there is a difference in preference across genders. From the crosstab in Figure 3.44 you find that 76.7% of the males liked the color red as compared to 48.6% of the females.
The note at the top of the output indicates that nonresponse rows are excluded from the analysis. The note at the bottom of the output indicates that it is assumed that the multiple response is a check all that applies type question. This means that a respondent can select more than one response to the question. The tests are performed using only those rows with responses. The three rows that did not have responses for the question are not included.
Tip: You can obtain the same output using the Multiple tab. Select What colors do you like? (with nonresponse) as a Multiple Delimited response and What is your Gender? as a grouping variable.