 Example of Boosted Tree with a Continuous Response
In this example, you construct a boosted tree model to predict the percent body fat given a combination of nominal and continuous factors.
1. Select Help > Sample Data and open the Body Fat.jmp sample data table.
2. Select Analyze > Predictive Modeling > Boosted Tree.
3. Select Percent body fat and click Y, Response.
4. Select Age (years) through Wrist circumference (cm) and click X, Factor.
5. Select Validation and click Validation.
6. Click OK.
7. Click OK.
Figure 6.4 Overall Statistics for Continuous Response
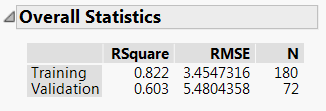
The Overall Statistics report provides the R-square and RMSE for the boosted tree model. The R-square for the validation set is 0.603. The RMSE for the validation set is about 5.48.
You are interested in obtaining a model-independent indication of the important predictors for Percent body fat.
8. Click the red triangle next to Boosted Tree for Percent body fat and select Profiler.
9. Click the red triangle next to Prediction Profiler and select Assess Variable Importance > Independent Uniform Inputs.
Note: Because Assess Variable Importance uses randomization, your results might not exactly match those in Figure 6.5.
Figure 6.5 Summary Report for Variable Importance
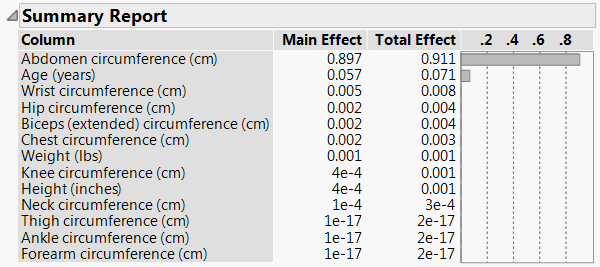
The Summary Report shows that Abdomen circumference (cm) is the most important predictor of Percent body fat.