Example of Latent Class Analysis
This example uses the Latent Class Analysis platform to analyze responses to a 2005 survey of US high school students. The survey asked students a variety of multiple choice questions regarding health-risk behaviors.
In this example, you fit a latent class model to identify clusters of students based on their responses to 12 questions. The columns that you analyze were obtained from multiple choice survey questions by binning the responses into two classes (Yes/No).
1. Select Help > Sample Data Library and open Health Risk Survey.jmp.
2. In the Health Risk Survey data table, click the green triangle next to the Launch LCA Platform script.
The script selects the 12 columns of interest, opens the Latent Class Analysis launch window, and enters the 12 columns of interest as Y.
Note: To launch the LCA Platform on your own, select Analysis > Clustering > Latent Class Analysis.
3. Type 5 in the box next to Up to.
This option fits latent class models for 3 and up to 5 clusters.
4. Click OK.
Figure 15.2 Cluster Summary Report
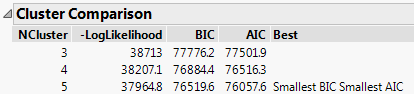
The Latent Class Analysis outline contains a Cluster Comparison report and three separate Latent Class Model reports. The Latent Class Model reports show the models for three, four, and five clusters. In the Cluster Comparison report, the model with five clusters has the smallest BIC and AIC, which indicates that it is the best fitting model out of the three. This is the model that you analyze.
5. In the Latent Class Model for 5 Clusters report, examine the bar charts under Parameter Estimates. Note the following:
– Cluster 1 has mostly No answers to all of the risk behaviors.
– Cluster 2 has high numbers of Yes answers for the four risk behaviors before the age of 13.
– Cluster 3 has high numbers of Yes answers for driving when drinking and five or more drinks in the past 30 days.
– Cluster 4 has high numbers of Yes answers for most of the risk behaviors except for the ones before the age of 13.
– Cluster 5 has the highest number of Yes answers for most of the risk behaviors.
Use this information to give the clusters meaningful names.
6. Click the red triangle next to Latent Class Model for 5 Clusters and select Rename Clusters:
– Enter Low Risk for Cluster 1.
– Enter Early Risk-Takers for Cluster 2.
– Enter Drinkers for Cluster 3.
– Enter Late High Risk for Cluster 4.
– Enter High Risk for Cluster 5.
7. Click OK.
8. Click OK in the JMP Alert that appears.
Note: The new cluster names are not saved to scripts.
Figure 15.3 Partial Parameter Estimates Report
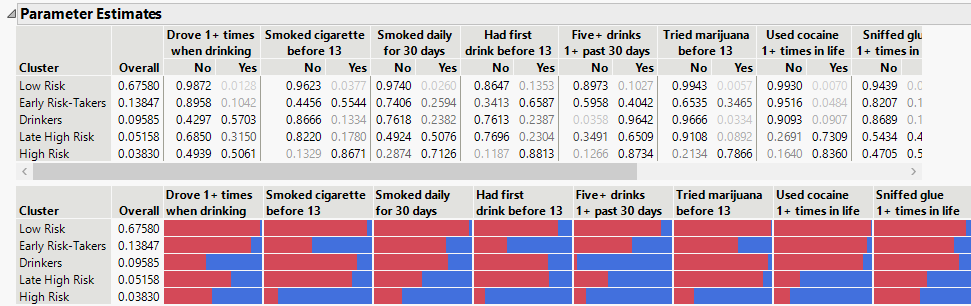
Figure 15.3 shows parameter estimates for the first eight variables in the analysis. The new cluster names appear in the report window.
Next, compare cluster membership to the demographic question “In what grade are you”.
9. Click the red triangle next to Latent Class Model for 5 Clusters and select Save Mixture and Cluster Formulas.
10. Select Graph > Graph Builder.
11. Enter In what grade are you as X.
12. Enter Most Likely Cluster Formula as Y.
13. Select the Mosaic element.
14. Click Done.
Figure 15.4 Mosaic Plot of Cluster Membership versus Grade Level
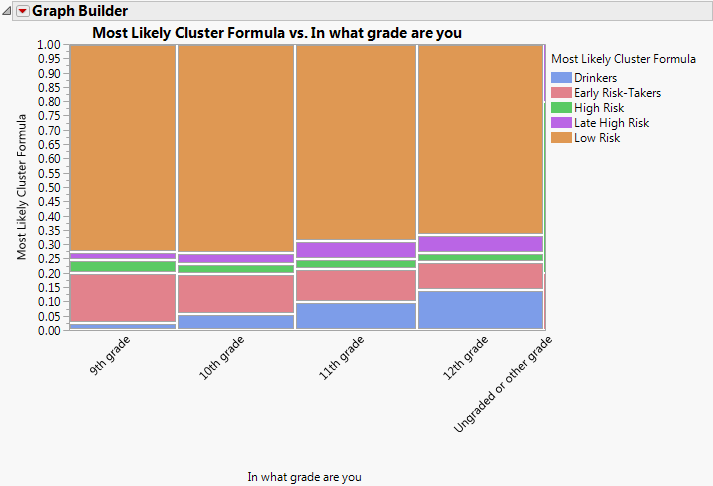
Observe that most of the respondents fall into the Low Risk cluster. The class labeled Drinkers includes more respondents as the grade level increases.