Example of Ordinal Logistic Regression
An experiment was conducted to test whether various cheese additives (A to D) had an effect on cheese taste. Taste was measured by a tasting panel and recorded on an ordinal scale from 1 (strong dislike) to 9 (excellent taste). See McCullagh and Nelder (1989). The data are in the Cheese.jmp sample data table.
1. Select Help > Sample Data Library and open Cheese.jmp.
2. Select Analyze > Fit Model.
3. Select Response and click Y.
Because you selected a column with the Ordinal modeling type, the Fit Model Personality updates to Ordinal Logistic.
4. Select Cheese and click Add.
5. Select Count and click Freq.
6. Click Run.
Figure 11.4 Ordinal Logistic Fit Report
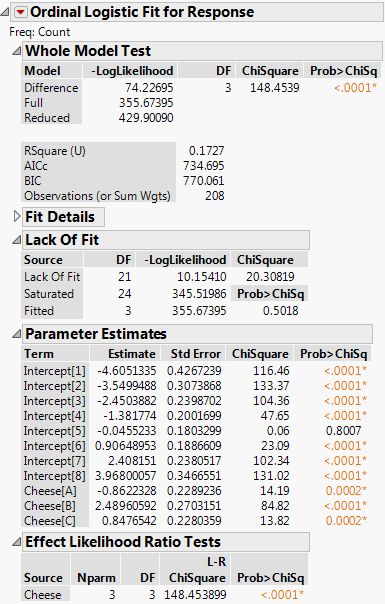
The model fit in this example reduces the –LogLikelihood of 429.9 for the intercept-only model to 355.67 for the full model. This reduction yields a likelihood ratio chi-square statistic for the whole model of 148.45 with 3 degrees of freedom. Therefore, the difference in perceived cheese taste is highly significant.
The most preferred cheese additive is the one with the most negative parameter estimate. Cheese[D] does not appear in the Parameter Estimates report, because it does not have its own column of the design matrix. However, Cheese D’s effect can be computed as the negative sum of the others, and is shown in Table 11.1.
Cheese | Estimate | Preference |
A | –0.8622 | 2nd place |
B | 2.4896 | least liked |
C | 0.8477 | 3rd place |
D | –2.4750 | most liked |
Comparison to Nominal Logistic Model
The Lack of Fit report shows a test of whether the model fits the data well.
As an ordinal problem, each of the first eight response levels has an intercept, but there are only three parameters for the four levels of Cheese. As a result, there are 3 degrees of freedom in the ordinal model. The ordinal model is the Fitted model in the Lack of Fit test.
There are 28 rows with a nonzero value of Count in the data table, so there are 28 - 4 = 24 replicated points with respect to the levels of Cheese. Therefore, the Saturated model in the Lack of Fit test has 24 degrees of freedom.
As a nominal problem, each of the first eight response levels has an intercept as well as three parameters for the four levels of Cheese. As a result, there are 8 x 3 = 24 degrees of freedom in the nominal model. Therefore, the nominal model is the Saturated model in the Lack of Fit test.
In this example, the Lack of Fit test for the ordinal model happens to be testing the ordinal response model against the nominal model. The nonsignificance of Lack of Fit leads one to believe that the ordinal model is reasonable.