Example of Segmentation
In this example, you attempt to identify market segments for pizza preferences.
To see how to complete the launch window for this example, see step 1 to step 15 in the example Multiple Table Format. Otherwise, follow the instructions below.
Define Clusters
1. Select Help > Sample Data Library and open Pizza Responses.jmp.
2. Click the green triangle next to the Choice script.
3. Click the Choice Model: Choice red triangle and select Save Gradients by Subject.
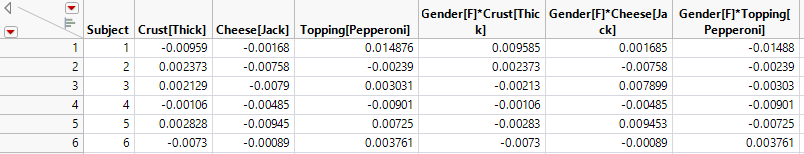
A data table appears with gradient forces saved for each main effect and subject interaction.
Figure 4.33 Gradients by Subject for Pizza Data, Partial View
4. Click the green triangle next to the Hierarchical Cluster script.
Figure 4.34 Dendrogram of Subject Clusters for Pizza Data
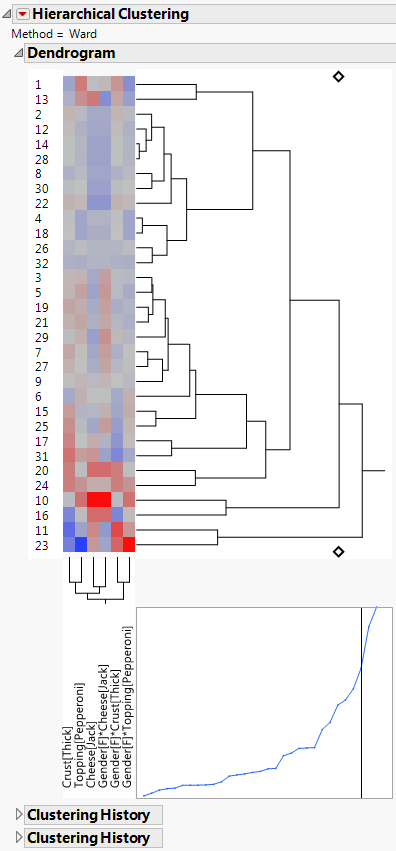
The script runs a hierarchical cluster analysis on all columns in the gradient table, except for Subject. Click either diamond to see that the rows have been placed into three clusters.
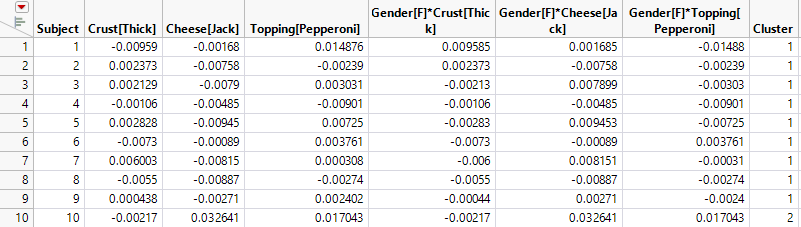
5. Click the Hierarchical Clustering red triangle and select Save Clusters.
A new column called Cluster is added to the data table containing the gradients. Each subject has been assigned a Cluster value that is associated with other subjects having similar gradient forces. See Hierarchical Cluster in Multivariate Methods for a discussion of other Hierarchical Clustering options.
You can delete the gradient columns because they were used only to obtain the clusters.
6. Select all columns except Subject and Cluster. Right-click the selected columns and select Delete Columns.
7. Click the green triangle next to the Merge Data Back script (Figure 4.33).
The cluster information is merged into the Subject data table. The columns in the Subject data table are now Subject, Gender, and Cluster.
Figure 4.35 Subject Data with Cluster Column
This table can now be used for further analysis.
Explore the Clusters
1. Click the icon to the left of the Cluster variable in the columns panel and select Nominal.
2. Select Analyze > Fit Y by X.
3. Select Gender and click Y, Response.
4. Select Cluster and click X, Factor.
5. Click OK.
Figure 4.36 Contingency Analysis of Gender by Cluster
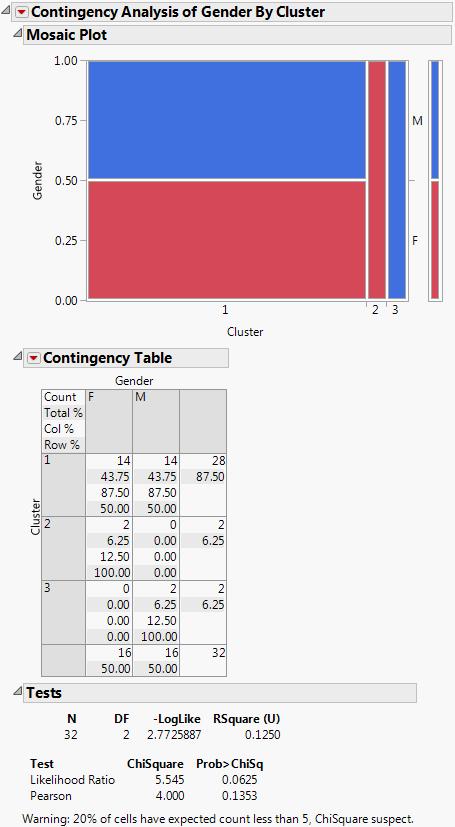
You see the following:
– Cluster 1 is evenly divided between males and females
– Cluster 2 consists of only females
– Cluster 3 consists of only males
If desired, you could now refit and analyze the model with the addition of the Cluster variable.