 Example of the Association Analysis Platform
This example uses the Grocery Purchases.jmp sample data table, which contains transactional data reported by a grocery store. The data table lists the items purchased by 1001 customers, each assigned a unique customer ID. You want to explore the associations among items in order to identify patterns in consumer behavior.
1. Select Help > Sample Data Library and open Grocery Purchases.jmp.
2. Select Analyze > Screening > Association Analysis.
3. Select Product and click Item.
4. Select Customer ID and click ID.
5. Click OK.
By default, the Rules report is sorted in decreasing order by Confidence. However, association rules with extremely high confidence also tend to have a higher number of items in the condition set. Since you want to view association rules with smaller condition sets, sort the report by Confidence, but in increasing order.
6. Right-click in the Rules report and select Sort By Column.
The Select Columns window appears.
7. Select Confidence and then check the Ascending option.
8. Click OK.
Figure 24.2 Association Analysis Report
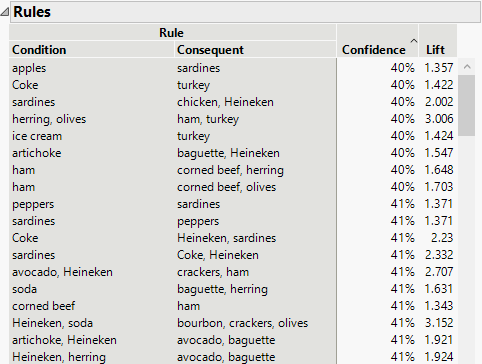
9. Scroll down the report to where the Confidence values are 58%.
There is an entry in the Rules report table that indicates that 58% of customers who bought an avocado also bought an artichoke. The value of Lift is 1.908, indicating that there is a likely dependency. You want to verify that avocados and artichokes occur in a significant portion of transactions.
10. Click the disclosure icon next to Frequent Item Sets.
Figure 24.3 Frequent Item Sets Report
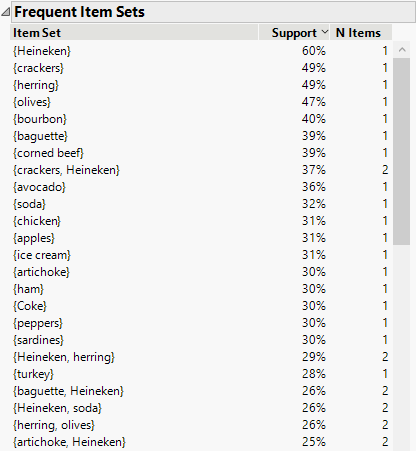
The Frequent Item Sets report shows that 36% of customers purchased avocados. The Rules report in Figure 24.2 shows that 58% of these customers also bought artichokes. Because of the large proportion of customers who follow this behavior, the grocery store management might use this information to strategically locate avocados and artichokes.
You also decide to look at the association rules with the highest lift.
11. Right-click in the Rules report table and select Sort By Column.
The Select Columns window appears.
12. Select Lift and click OK.
The Rules table is sorted by decreasing values of lift. Notice that the second association rule has a lift of 5.642 and 83% confidence. You want to verify that both the condition set, {chicken, ice cream}, and the consequent item set, {Coke, sardines}, have adequate support.
13. Right-click in the Frequent Item Sets report and select Sort By Column.
The Select Columns window appears.
14. Select Item Set and then check the Ascending option.
15. Click OK.
The Frequent Item Sets table is sorted alphabetically by item set. Scroll through the list to see that the condition item set, {chicken, ice cream}, has 14% support. The consequent item set, {Coke, sardines}, has 15% support. This association rule has high lift, but represents fewer transactions than the first association rule that you examined.