Example Using a Contour Function
The data in Fish Patty.jmp is adapted from Cornell (1990) and comes from an experiment to optimize the texture of fish patties. The columns Mullet, Sheepshead, and Croaker represent what proportion of the patty came from those fish types. The column Temperature represents the oven temperature used to bake the patties. The column Rating is the response and is a measure of texture acceptability, where higher is better. A response surface model was fit to the data and the prediction formula was stored in the column Predicted Rating. See Mixture Profiler in Profilers.
1. Select Help > Sample Data Library and open Fish Patty.jmp.
2. From the Graph menu, select Ternary Plot.
3. Select Mullet, Sheepshead, and Croaker and click X, Plotting.
4. Select Predicted Rating and click Contour Formula.
5. Click OK.
6. Click the Ternary Plot red triangle and select Contour Fill > Fill Above.
Figure 11.8 Ternary Plot with a Contour Formula
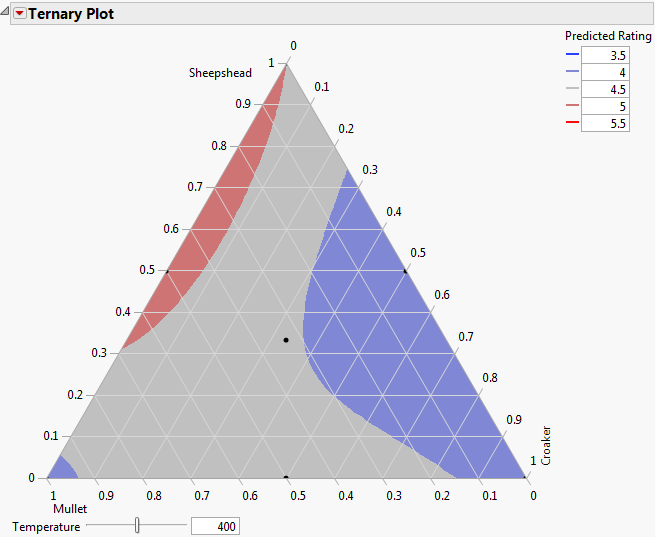
The manufacturer wants the rating to be at least 5. You can drag the slider for Temperature and see the contours for the Predicted Rating change. Each point represents a mixture of the three fish. Any given mixture of fish types receives different ratings according to the temperature at which the patties are baked.
In this example, the red shaded area shows the mixture of fish that results in a rating of 5 to 5.5. Any purple areas show the mixture of fish that results in a rating of 4 and below. At 400 degrees, a mixture of mostly sheepshead and mullet with very little croaker results in a rating of 5 and above.