Publication date: 07/30/2020
Ternary Plots
View Plots for Compositional or Mixture Data
The Ternary Plot command in the Graph menu produces a three-axis plot.
Ternary plots are a way of displaying the distribution and variability of three-part compositional data. (For example, the proportion of sand, silt, and clay in soil or the proportion of three chemical agents in a trial drug.) You can use data expressed in proportions or use absolute measures.
The ternary display is a triangle with sides scaled from 0 to 1. Each side represents one of the three components. A point is plotted so that a line drawn perpendicular from the point to each leg of the triangle intersect at the component values of the point.
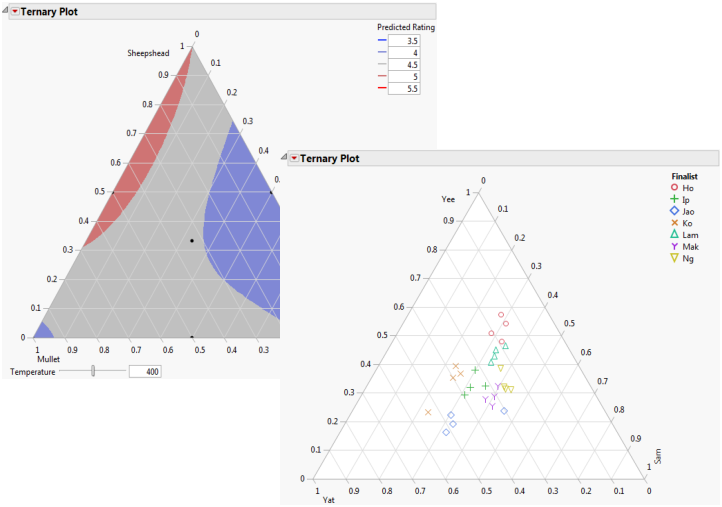
Figure 11.1 Examples of Ternary Plots
Contents
Example of a Ternary Plot
Launch the Ternary Plot Platform
The Ternary Plot
Mixtures and Constraints
Ternary Plot Platform Options
Additional Examples of the Ternary Plot Platform
Example Using Mixture Constraints
Example Using a Contour Function
Want more information? Have questions? Get answers in the JMP User Community (community.jmp.com).