Explanation of Statistics
You can add columns of descriptive summary statistics for any numeric column in the source table by clicking the Statistics button and making a selection from the menu.
The Statistics menu gives these summary statistics for numeric columns:
N
The number of nonmissing values.
Mean
The arithmetic mean of a column’s values. It is the sum of nonmissing values (and if defined, multiplied by the weight variable) divided by the Sum Wgt.
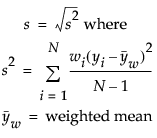
Std Dev
The sample standard deviation, computed for the nonmissing values and calculated with the specified weight variable. It is the square root of the sample variance. The formula follows:
Min
The smallest nonmissing value in a column.
Max
The largest nonmissing value in a column.
Range
The difference between Max and Min.
% of Total
The percent of the total count for each group. Or, if you have so specified, the percent of nonmissing values of the column to the total count for each group.
N Missing
The number of missing values.
N Categories
The number of distinct categories.
Sum
The sum of all values in a column.
Sum Wgt
The sum of all weight values in a column. (See Column Properties in the The Column Info Window section.) Or, if no column is assigned the weight role, Sum Wgt is the total number of nonmissing values.
Variance
The sample variance, computed for the nonmissing values. It is the sum of squared deviations from the mean, divided by the number of nonmissing values minus one.
Std Err
The standard error of the mean. It is the standard deviation divided by the square root of N. If a column is assigned the role of weight, then the denominator is the square root of the sum of the weights.
CV (Coefficient of Variation)
The measure of dispersion, which is the standard deviation divided by the mean multiplied by one hundred.
Median
The 50th percentile, which is the value where half the data are below and half are above or equal to the 50th quantile (median).
Geometric Mean
The nth root of the product of the data. For example, geometric means are often used to calculate interest rates. The statistic is also helpful when the data contains a large value in a skewed distribution.
Note: The Summary platform treats negative values and zeroes as excluded.
Interquartile Range
The difference between the third and first quartiles.
Quantiles
the value at which the specific percentage of the argument is less than or equal to. For example, 75% of the data is less than the 75th quantile. The summary window has an edit box for entering the quantile percentage that you want.
Histogram
Generates histograms for different groups. Images of the histograms are saved in data table Expression columns.