Fit Competing Risk Mixture
The Fit Competing Risk Mixture option enables you to fit competing risk mixture distributions. It estimates the probability that a given observation fails due to the cause represented by each of the component mixture distributions. For an example, see Fit Competing Risk Mixture Example.
The competing risk mixture probability distribution function F(x) is defined as follows:
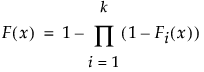
where Fi(x) represents the cumulative failure distributions for the ith risk and k is the number of components (or risks) in the mixture. The Fit Competing Risk Mixture option attempts to identify clusters of observations that are drawn from each of the component distributions, Fi(x). It estimates the parameters of the mixture and the probability that an observation is drawn from any given component.
The Competing Risk Mixture report is structured in a fashion that mirrors the Mixture report. See Mixture. However, the Fit Competing Risk Mixture reports do not show a Density Overlay plot. They show a Distribution Overlay plot instead.
Distribution Overlay Plot
The Distribution Overlay plot shows the cumulative distribution functions for each of the mixture components and for the combined mixture (Aggregated). A legend to the right of the plot enables you to select which cumulative distribution functions appear.