Publication date: 07/30/2020
Fit Mean
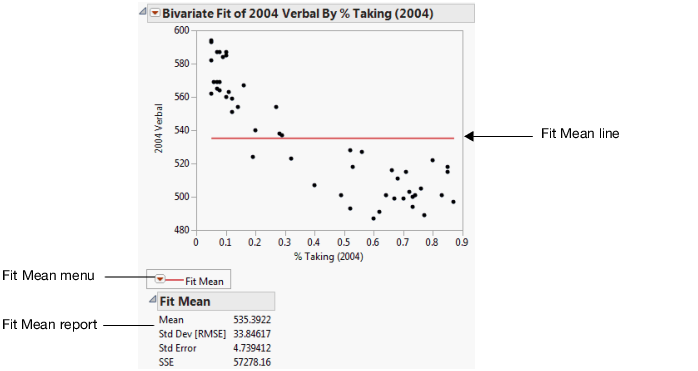
Using the Fit Mean option, you can add a horizontal line to the scatterplot that represents the mean of the Y response variable. You can start by fitting the mean and then use the mean line as a reference for other fits (such as straight lines, confidence curves, polynomial curves, and so on).
Figure 5.7 Example of Fit Mean
Want more information? Have questions? Get answers in the JMP User Community (community.jmp.com).