Limits Specifications
You can specify computations for control limits by entering a value for k (K Sigma), or by entering a probability for α (Alpha), or by retrieving a limits value from the process columns' properties or a previously created Limits Table. Limits Tables and the Get Limits button are discussed in the section Saving and Retrieving Limits. There must be a specification of either K Sigma or Alpha. The window default for K Sigma is 3.
KSigma
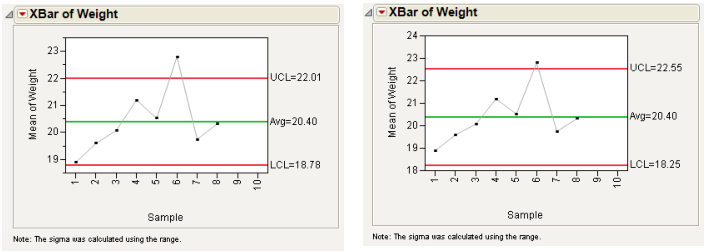
The KSigma parameter option enables specification of control limits in terms of a multiple of the sample standard error. KSigma specifies control limits at k sample standard errors above and below the expected value, which shows as the center line. To specify k, the number of sigmas, click the radio button for KSigma and enter a positive k value into the text box. The usual choice for k is 3, which is three standard deviations. The examples shown in Figure 12.5 compare the XBar chart for the Coating.jmp data with control lines drawn with KSigma = 3 and KSigma = 4.
Figure 12.5 K Sigma =3 (left) and K Sigma=4 (right) Control Limits
Alpha
The Alpha parameter option specifies control limits (also called probability limits) in terms of the probability α that a single subgroup statistic exceeds its control limits, assuming that the process is in control. To specify alpha, click the Alpha radio button and enter the desired probability. Reasonable choices for α are 0.01 or 0.001. For XBar charts under the assumption of normality and known in-control parameters, the Alpha value equivalent to a KSigma of 3 is 0.0027.