Limits
All data are treated as historical data when the number of historical rows is not specified in the launch window. See Launch the Model Driven Multivariate Control Chart Platform.
T2
The upper control limit (UCL) for historical data is based on the Beta distribution and defined as:
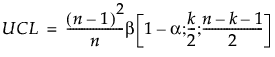
where:
n = number of historical data observations
k = number of PCA or PLS components
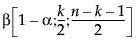 = (1−α)th quantile of a Beta
 distribution.
The UCL for current data is based on the F distribution and defined as:
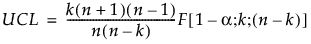
where:
n = number of historical data observations
k = number of PCA or PLS components
F(1-α; k; n-k) = (1−α)th quantile of an F(k; n-k) distribution.
DModX
For PCA and PLS models, the UCL is based on the F distribution. The DModX UCL for PCA models is defined as:

where
n = number of historical data observations
k = number of PCA components
p = number of variables
F(1-α; n-p-1; p-k) = (1−α)th quantile of an F(n-p-1; p-k) distribution.
The DModX UCL for PLS models is defined as:
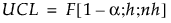
where
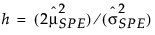
 = historical sample mean of SPE
 = historical sample variance of SPE
n = number of historical data observations
F(1-α; h; nh) = (1−α)th quantile of an F(h; nh) distribution.
SPE
The SPE UCL for PCA models is defined as:
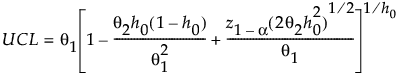
where
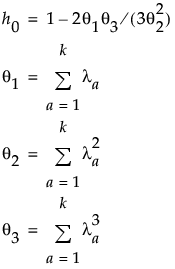
λa = the ath eigenvalue
k = number of PCA components
z1−α = (1−α)th quantile of the standard normal distribution
For more information about SPE control limits for PCA models, see Jackson and Mudholkar (1979).
For PLS models, the UCL is based on the chi-square distribution and defined as:
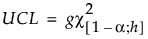
where

 = historical sample mean of SPE
 = historical sample variance of SPE
Χ2(1-α; h) = (1−α)th quantile of an Χ2(h) distribution
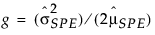
The g and h parameters are estimated by the method of moments. For more information about SPE control limits for PLS models, see Nomikos (1995).