Publication date: 07/30/2020
Make the Design Table
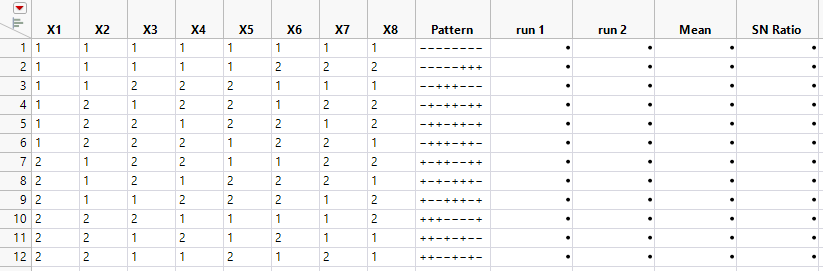
When you click Make Table, a table similar to the one in Figure 14.12 appears. In the data table, each row represents an inner array run. In the values for the Pattern variable, plus signs designate high levels, and minus signs represent low levels. The table also contains a column for each factor and a column for each pattern that appears in the Pattern column. The columns for the patterns contain the responses to the experiment. If you selected Simulate Responses from the Taguchi Design red triangle menu, the pattern columns are filled with simulated response values.
Figure 14.12 Taguchi Design Table for an Eight Factor L12 Design
Want more information? Have questions? Get answers in the JMP User Community (community.jmp.com).