Model Comparison Report
To create the report shown in Figure 13.8, select Sigmoid Curves > Logistic Curves > Fit Logistic 4P and Sigmoid Curves > Fit Gompertz 4P from the Fit Curve red triangle menu.
Figure 13.8 Model Comparison Report
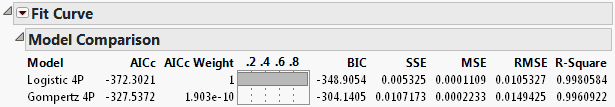
The Model Comparison report shows fit statistics used for comparing multiple models. The statistics are AICc, AICc Weight, BIC, SSE, MSE, RMSE, and R-Square, and are defined below.
AICc
Gives a measure of the goodness of fit of an estimated statistical model that can be used to compare two or more models. AICc is a modification of the AIC adjusted for small samples. AICc can be computed only when the number of data points is at least two greater than the number of parameters. The model with the lowest AICc value is the best, which is the Logistic 4P in our example. See Likelihood, AICc, and BIC in Fitting Linear Models.
AICc Weight
Gives normalized AICc values that sum to one. The AICc weight can be interpreted as the probability that a particular model is the true model given that one of the fitted models is the truth. Therefore, the model with the AICc weight closest to one is the better fit. In our example, the Logistic 4P model is clearly the better fit. The AICc weights are calculated using only nonmissing AICc values, as follows:
AICcWeight = exp[-0.5(AICc-min(AICc))] / sum(exp[-0.5(AICc-min(AICc))])
where min(AICc) is the smallest AICc value among the fitted models. The AICc Weight column is then sorted in decreasing order.
BIC
Gives a measure based on the likelihood function of model fit that is helpful when comparing different models. The model with the lower BIC value is the better fit. See Likelihood, AICc, and BIC in Fitting Linear Models.
SSE
The sum of the squared differences between each observation and its predicted value.
MSE
Gives the average of the squares of the errors of each value.
RMSE
The square root of the MSE that estimates the standard deviation of the random error.
R-Square
Estimates the proportion of variation in the response that can be attributed to the model rather than to random error. The model with the R-Square value closest to one is the better fit.
The Model Comparison platform provides additional options, such as plotting residual and actual values. See Model Comparison.