Nonparametric Density Contours
The nonparametric density contour shows contours that approximately encompass a specified proportion of the points. You add nonparametric density contours to see patterns in point density when the scatterplot is darkened by thousands of points.
This feature is particularly valuable when you have many points on a 3D scatterplot; the contours can be so dark that you cannot see the structure. In this situation, you remove the points so that only the contours are displayed. See Optimizing a Dense Nonparametric Density Contour.
When you add nonparametric density contours to a 3D scatterplot, you specify whether you want a contour for all of the data or for a specific group of data. The contour for each set of grouped data is color-coded to differentiate one group from another.
You display and remove nonparametric density contours by selecting and deselecting Nonpar Density Contours from the red triangle menu.
• Example of a Grouped Nonparametric Density Contour
Density Contour Controls
The Density Contour Controls options are displayed below the 3D scatterplot. These options let you select additional contours and change each contour’s formatting.
Figure 9.5 The Density Contour Controls Window
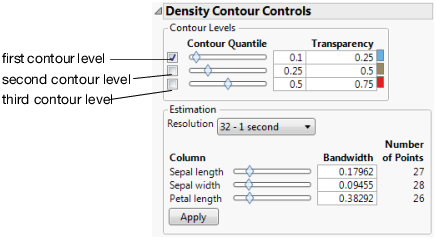
Contour Quantile
Controls which contours are shown and lets you customize the contour formatting.
– Density level represents the volume and density of the points. As the contours go from smaller to larger values, the contours cover less volume but more dense areas. A 0.9 contour represents the 10% densest part of the total, where the points are closest together. Click and drag the slider below “Contour Quantile,” or enter a value next to the slider.
– Transparency changes the surface of density contours. The greater the value, the more opaque the contour. Enter a value in the box.
– Color changes the color of the contour. Click the colored box and select a different color. (This option only appears for ungrouped density contours.)
Changes to these settings take effect immediately.
Resolution
Changes the resolution of the contours. A higher resolution results in a less granular drawing of the contours but takes more time to display.
Column Bandwidth
Changes the smoothness of the fitted density. A higher bandwidth results in a smoother fitted density.
Type a new bandwidth for each variable, or click and drag the sliders. Click Apply to display your changes.
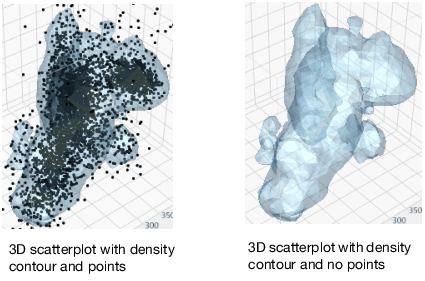
Optimizing a Dense Nonparametric Density Contour
When you have many points on a 3D scatterplot, the contours can be so dark that you cannot see the structure. In this situation, you remove the points so that only the contours are displayed.
To remove points from a 3D scatterplot, select Show Points from the red triangle menu. You can further optimize the contours by changing their size, color, and transparency. See Scatterplot 3D Platform Options.
Figure 9.6 Example of Optimizing a Dense Nonparametric Density Contour