Publication date: 07/30/2020
Pareto Plots
Focus Improvement Efforts on the Vital Few
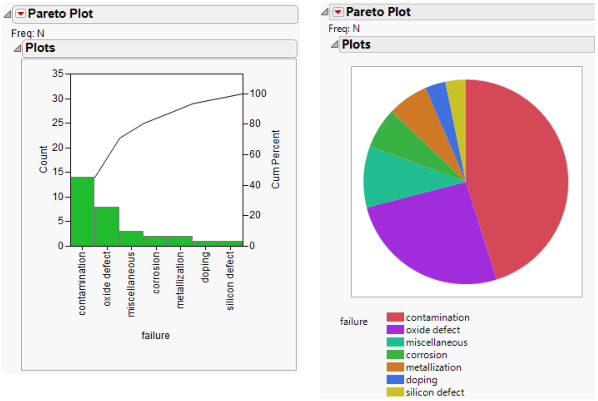
Improve the statistical quality of your process or operation using Pareto plots. A Pareto plot is a chart that shows severity (frequency) of problems in a quality-related process or operation. Pareto plots help you decide which problems to solve first by highlighting the frequency and severity of problems.
Figure 13.1 Pareto Plot Examples
Contents
Overview of the Pareto Plot Platform
Example of the Pareto Plot Platform
Launch the Pareto Plot Platform
The Pareto Plot Report
Pareto Plot Platform Options
Causes Options
Additional Examples of the Pareto Plot Platform
Threshold of Combined Causes Example
Using a Constant Size across Groups Example
Using a Non-Constant Sample Size across Groups Example
One-Way Comparative Pareto Plot Example
Two-Way Comparative Pareto Plot Example
Statistical Details for the Pareto Plot Platform
Likelihood Ratio Chi-Square Test
Want more information? Have questions? Get answers in the JMP User Community (community.jmp.com).