Select Columns in the Columns Viewer
The Columns Viewer option in the Cols menu helps you quickly select columns by attributes, properties, and statistics, particularly in a data table that has many columns. You can view summary statistics and properties for those columns, view quartiles in the summary statistics, subset the data, and more. And columns in the Columns Viewer window are also linked to the data table columns.
Figure 4.11 Linked Columns in the Column Viewer

The Columns Viewer gives you a quick view of data table characteristics. For example, the Summary Statistics report shows which columns contain missing values. You can select those columns in the report and then exclude them in the data table.
Figure 4.12 Identify Missing Values
The Summary Statistics report shows the following information:
• the total number of rows (N)
• the number of rows with missing values (N Missing)
• the number of categories (N Categories)
• for continuous data, the Min, Max, Mean, and Std Dev
Other options include the following:
Clear Select
Deselects columns in the data table and in the Columns Viewer. This option ensures that no columns are selected before you begin selecting columns.
Subset
Creates a linked subset data table from the selected columns.
Show Summary
Creates a linked Summary Statistics report for the selected columns. Right-click to select options such as sorting by column or creating a data table. Select Show Quartiles to include lower quartiles, upper quartiles, and interquartile ranges. To create a linked data table from all columns in the report, click the Summary Statistics red triangle and select Data Table View.
Find Columns with Properties
Shows a list of column properties in the Columns with Properties report. Select the properties that you want to find and then click OK to create a linked report from all columns. Or you can select columns first in the Select Columns list and then show the list of properties just for those columns.
Notes:
• Each time you click the Show Summary or Find Columns with Properties buttons, a new report is added to the window. To delete a report, select Remove from the report’s red triangle menu.
• Deleting rows from a data table view created from Columns Viewer is not undoable.
Example of Finding Columns with a Specific Property
This example shows how to find columns that have a Formula property and then view all formulas at once.
1. Select Help > Sample Data Library and open Consumer Preferences.jmp.
2. Select Cols > Columns Viewer to open the Data Table Columns Viewer window.
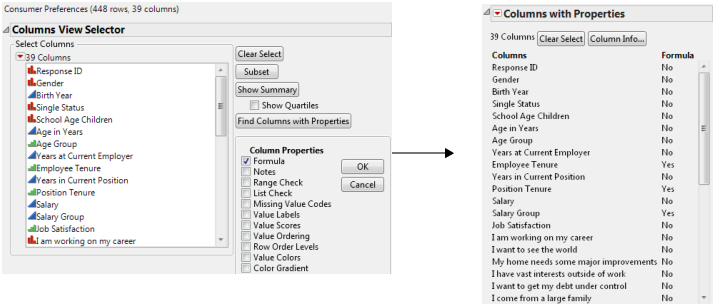
3. Select Find Columns with Properties, select Formula, and click OK.
The Columns with Properties report appears. Several columns include the Formula property. Because the list is so long, you want to view all formula columns together.
Figure 4.13 Select the Formula Column Property
4. Right-click the report, select Sort by Column, Formula, and then click OK.
Columns that have a Formula property appear at the top of the report.
Figure 4.14 Sort by Column
5. Select the Employee Tenure, Position Tenure, and Salary Group columns and select Column Info.
Formulas for the selected columns appear in the data table’s Column Settings window.
Example of Showing Summary Statistics
This example shows how to find columns with a low standard deviation. This can be helpful if you want to delete or exclude that data from an analysis.
1. Select Help > Sample Data Library and open Semiconductor Capability.jmp.
2. Select Cols > Columns Viewer to open the Data Table Columns Viewer window.
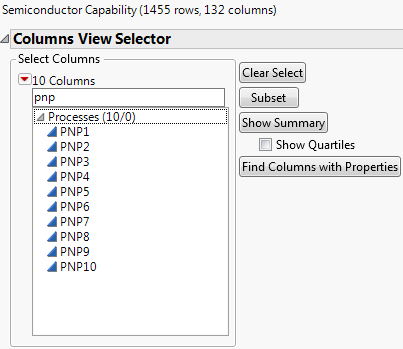
3. Click the Select Columns red triangle and select Name Starts With.
4. Type PNP and press Enter to select the PNP columns.
Figure 4.15 Filter Columns by Name
5. Click Show Summary to add the Summary Statistics report.
The rows show the minimum, maximum, mean, and standard deviation for each column.
Figure 4.16 Summary Statistics for Selected Columns
6. Right-click in the report and select Sort by Column.
7. Select Std Dev and Ascending, and then click OK.
Notice that PNP6 has no standard deviation, because the minimum, maximum, and mean values are 0.
Figure 4.17 Sorted Std Dev Column
8. In the Summary Statistics report, select the row for PNP6 and then display the data table.
9. View the data table and press Delete to remove the selected column.
The column is instantly removed from the data table.
10. To close the Columns Viewer, click the X button in the upper right corner (Windows) or upper left corner (macOS) of the window.