Publication date: 07/30/2020
Self Organizing Map Report
Figure 13.9 Self Organizing Map Report
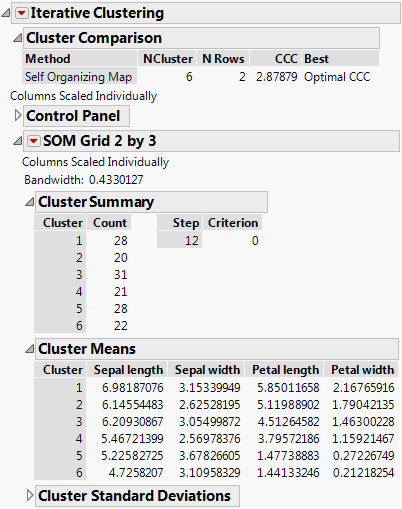
The Cluster Comparison Report shows the total number of clusters and also the number of rows requested. The SOM report is named according to the Grid size requested. The Bandwidth is given at the top of the SOM Grid report. The report itself is analogous to the K Means NCluster report. See K Means Report.
For more information about the red triangle options for Self Organizing Maps, see K Means Report Options.
Want more information? Have questions? Get answers in the JMP User Community (community.jmp.com).