Step 4: Interacting with Platform Results
All platforms produce results that are interactive, for example, the following results:
• Reports can be shown or hidden.
• Additional graphs and statistical details can be added or removed to suit your purposes.
• Platform results are connected to the data table and to each other.
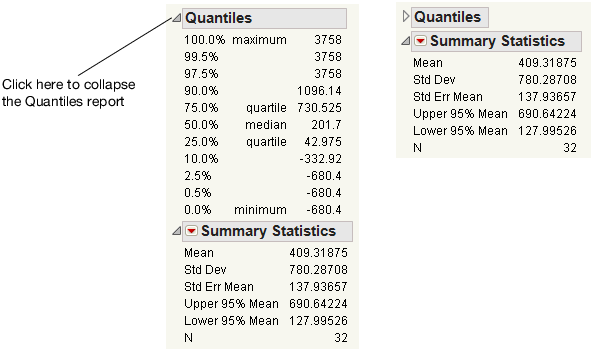
For example, to close the Quantiles report, click the disclosure icon next to Quantiles.
Figure 2.9 Close the Quantiles Report
Platform results are connected to the data table. The histogram in Figure 2.10 shows that a group of companies makes a much higher profit that the others. To quickly identify that group, click the histogram bar for them. The corresponding rows in the data table are selected.
Figure 2.10 Connection between Platform Results and Data Table
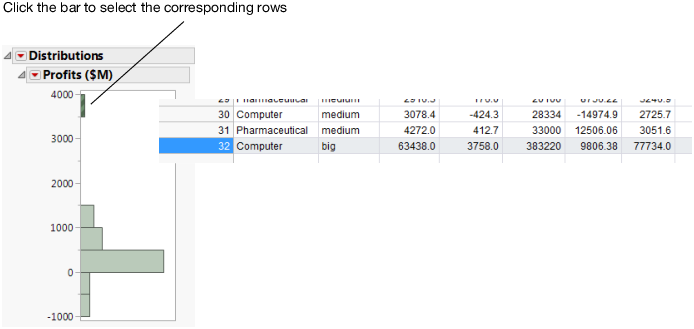
In this case, the group includes only one company, and that one row is selected.