The Destructive Degradation Plot Options and Models
The Degradation Data Analysis plot shows the data and a graphical representation of the model that is currently specified based on selections of Distribution, Transformation, and Path Definition. The plot shown in Figure 8.11 is for the Adhesive Bond.jmp data table and represents a model that includes an optional X variable.
Figure 8.11 Destructive Degradation Plot and Options
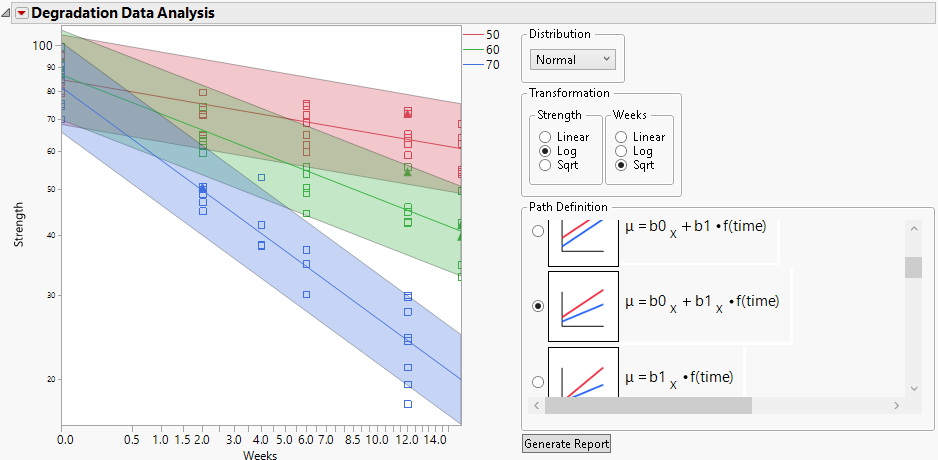
Note the following about the plot:
• Data values are represented by markers.
Icon | Description |
|---|---|
| An exact measurement.
|
| Left-censored observation, indicating that the censored measurement is below the triangle. Note: In the Degradation platform, left-censoring arises only when observations are interval censored. See Specify Two Y Columns. |
| Right-censored observation, indicating that the censored measurement is above the triangle. |
| Interval-censored observation, indicating that the censored value is within the specified interval.
|


Note: By default, the markers are not colored. To color them to match the model color scheme, select Rows > Color or Mark by Column. Select the X column. Deselect Continuous Scale. Select JMP Default from the Colors menu.
• For each level of X, a colored band appears. If the model does not include an X variable, then a single band appears. For a given value of Time, the upper and lower bounds of the band are the 0.05 and 0.95 percentiles of the fitted distribution of Y. The colors of the bands correspond to the values of X, as indicated by the legend to the upper right of the plot.
Note: Marker colors correspond to the color states assigned in the data table.
• The solid curve in the center of a band is the median of the fitted distribution of Y for the corresponding value of X over time. If the model does not include an X variable, then the curve plots the median of Y over time.