 The Functional Data Explorer Report
The initial Functional Data Explorer report contains a Data Processing report and a Summaries report.
Figure 15.6 Initial Functional Data Explorer Report
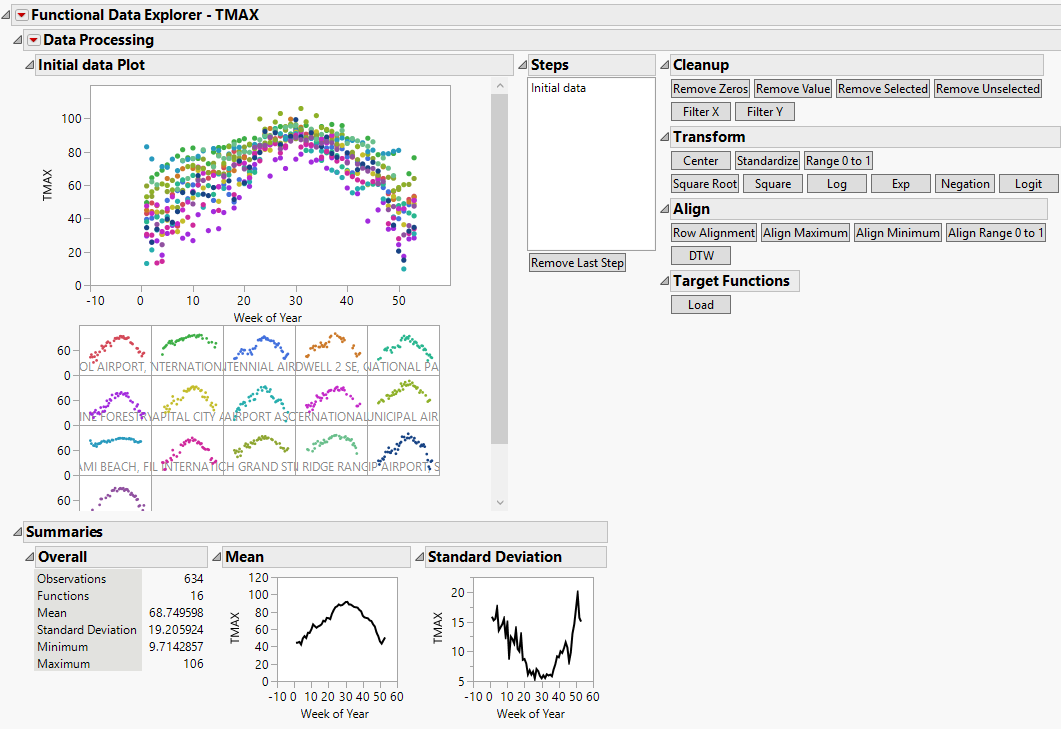
The Data Processing Report includes an initial data plot of all observations, as well as a matrix of individual data plots for each level of the ID variable. All graphs plot the functional response data over the values of the input variable. If specified, the individual data plots for the validation set or target functions are shown at the bottom of the matrix. There are also data processing buttons.
The Summaries report contains a table of overall summary statistics, including the number of observations, number of functions, and the overall mean, standard deviation, minimum, and maximum values. There are also plots of the functional mean and functional standard deviation. The functional summary statistics displayed in the plots are computed at each unique value of the input variable.
The Data Processing and Summaries reports are useful for preprocessing your data prior to fitting a model. There are data cleaning, transformation, and alignment buttons available in the Data Processing Report that correspond to the options in the Data Processing red triangle menu. See Data Processing Report Options. Each time you perform a preprocessing step, the graphs and summary results are automatically updated. You can perform multiple preprocessing steps in sequence. Each step is added to the Steps list of the Data Processing report. To remove the most recent step, click the Remove Last Step button below the Steps outline.