Two-Factor Nested Random Effects Model
Consider a model with two factors, A and B, but where B is nested within A. Although there are situations where a nested effect is treated as a fixed effect, in most situations a nested effect is treated as a random effect. For this reason, in the model described below, the nested effect is entered as a random effect.
Effects to be entered: A, B[A]&Random
1. In the Select Columns list, select two nominal or ordinal effects, A and B.
2. Click Add.
3. To nest B within A: In the Construct Model Effects list, select B. In the Select Columns list, select A. The two effects should be highlighted.
4. Click Nest.
5. With B[A] highlighted in the Construct Model Effects list, select Attributes > Random Effect.
Example of Two-Factor Nested Random Effects Model
As part of a measurement systems analysis study, 24 randomly chosen parts are measured. These parts are evenly divided among the six operators who typically measure these parts. Each operator makes three independent measurements of each of the four assigned parts.
Since the parts measured by one operator are measured only by that specific operator, Part is nested within Operator. Since the parts are a random sample of production, Part is considered a random effect. Since these specific six operators are of interest, Operator is treated as a fixed effect. The appropriate model is specified as follows.
1. Select Help > Sample Data Library and open Variability Data/2 Factors Nested.jmp.
2. Select Analyze > Fit Model.
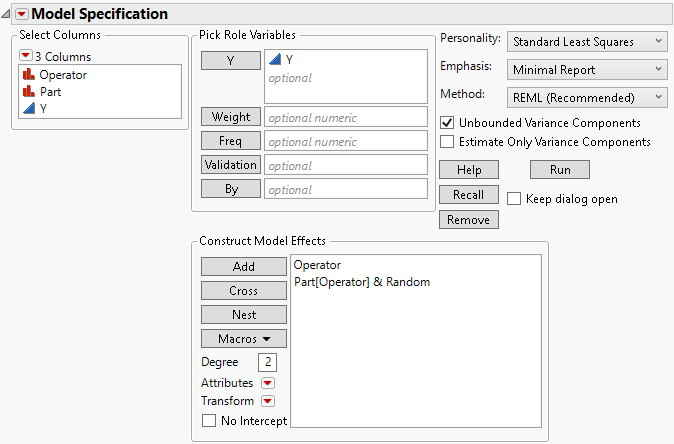
3. In the Select Columns list, select Y and click Y.
4. In the Select Columns list, select Operator and Part.
5. Click Add.
6. To nest Part within Operator: In the Construct Model Effects list, select Part. In the Select Columns list, select Operator. The two effects should be highlighted.
7. Click Nest.
8. With Part[Operator] highlighted in the Construct Model Effects list, select Attributes > Random Effect.
Figure 2.17 Fit Model Window for Two-Factor Nested Random Effects Model
9. Click Run to obtain the Fit Least Squares report.
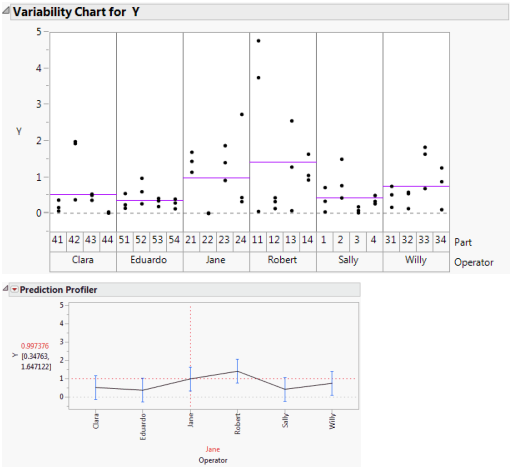
Figure 2.18 shows two plots. The first is a Variability Chart showing the three measurements by each Operator on each of the four parts. Horizontal line segments show the mean measurement for each Operator.
To construct the Variability Chart in Figure 2.18, in the 2 Factors Nested.jmp sample data table, run the data table script Variability Chart - Nested. Click the Variability Gauge red triangle, deselect Show Range Bars, and select Show Group Means.
The second plot is the Fit Least Squares report Prediction Profiler plot for Operator. This plot shows the predicted response for each operator. The vertical dashed red line set at Jane indicates that Jane’s predicted response is 0.997. You can see the correspondence between the model predictions given in the Prediction Profiler plot and the raw data in the Variability Chart.
To obtain the Prediction Profiler plot, click the Response Y red triangle and select Factor Profiling > Profiler.
These plots show how the predicted measurements for each Operator are modeled. However, keep in mind that you are not only interested in whether the operators differ in how they measure parts. You are also interested in the variability of the part measurements themselves, which requires estimation of the variance component associated with Part.
Figure 2.18 Model Fit for Two-Factor Nested Random Effects Model