Two-Way Analysis of Variance
Effects to be entered: A, B
1. In the Select Columns list, select two nominal or ordinal effects, A and B.
2. Click Add.
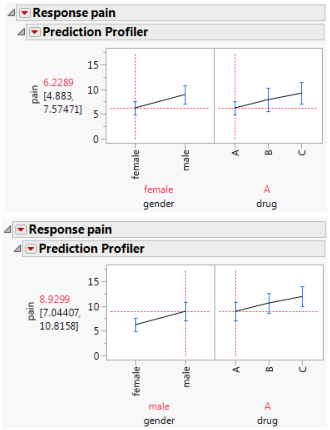
Figure 2.9 shows two profiler plots of the fit to the data for the Analgesics.jmp sample data table. The model effects are gender and drug. The response is pain. To obtain this plot, select Analyze > Fit Model, select pain as Y, select gender and drug as model effects, and then click Run. Click the Response Pain red triangle and select Factor Profiling > Profiler.
The line segments in each plot connect the predicted values for the settings defined by the vertical dashed red lines. Move these to see predictions at other settings.
The top plot in Figure 2.9 shows predictions for females, whereas the bottom plot shows predictions for males. Note that the relative effects of the three drugs are consistent across the levels of gender. This is because there is no interaction term in the model. For an example with interaction, see Figure 2.11.
Figure 2.9 Model Fit for a Two-Way Analysis of Variance with No Interaction