View the Surface Using the Contour Profiler
The Contour Profiler shows contours of the response surface. It gives an alternate profiler visualization of the predicted response in the area of the critical point.
1. Click the Response Y red triangle and select Factor Profiling > Contour Profiler.
2. Click the Contour Profiler red triangle and select Contour Grid.
3. For Increment, type 1.
4. Click OK.
The contours are plotted at one unit intervals. See Figure 4.17.
5. Click the Prediction Profiler red triangle and select Factor Settings > Link Profilers.
Figure 4.17 Contour Profiler with Crosshairs at Critical Point
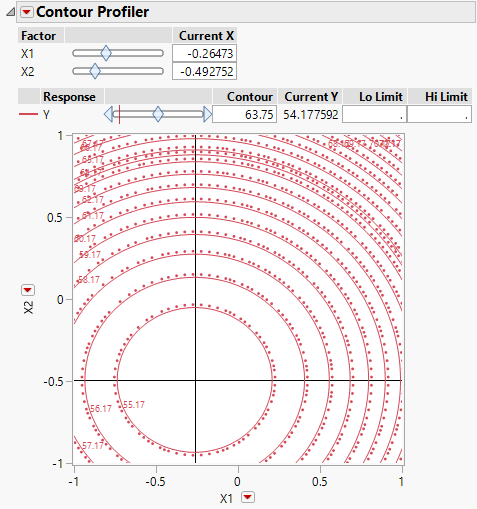
Linking the Contour Profiler to the Prediction Profiler links the Current X values in the Contour Profiler to the X values shown in the Prediction Profiler. The X values in the Prediction Profiler give the critical point where Y is minimized. The crosshairs in the Contour Profiler show the critical point. Notice that the Current Y value is 54.177592, the predicted minimum value according to the Prediction Profiler.
Often, it is not possible to set your process factors to exactly the values that optimize the response. The Contour Profiler can help you identify alternate settings of the process factors. In the next steps, suppose that you can set your process to X1 and X2 values with only one decimal place precision, and that your process settings can vary by one decimal place in either direction of those settings.
6. In the Contour Profiler report, under Current X, type -0.3 next to X1 and -0.5 next to X2.
Figure 4.18 Contour Profiler Showing X1 = -0.3 and X2 = -0.5
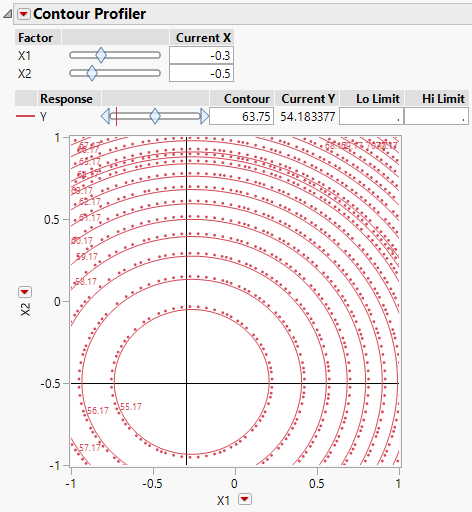
The crosshairs are well within the innermost contour and the Current Y (the predict Y value at the Current X settings) is 54.183377, only slightly different from the predicted minimum of 54.177592.
7. In the Contour Profiler, click and drag the crosshairs to explore Current X values within a 0.1 unit radius of X1 = -0.3 and X2 = -0.5.
The predicted Y values are all below 54.4. In fact, if the settings wander to any point within the innermost contour, the predicted Y is less than the contour value of 55.17.