Publication date: 07/30/2020
Visualize Your Data
Common Graphs
Visualizing your data is an important first step. The graphs described in this chapter help you discover important details about your data. For example, histograms show you the shape and range of your data, and help you find unusual data points.
This chapter presents several of the most common graphs and plots that enable you to visualize and explore data in JMP. This chapter is an introduction to some of JMP’s graphical tools and platforms. Use JMP to visualize the distribution of single variables, or the relationships among multiple variables.
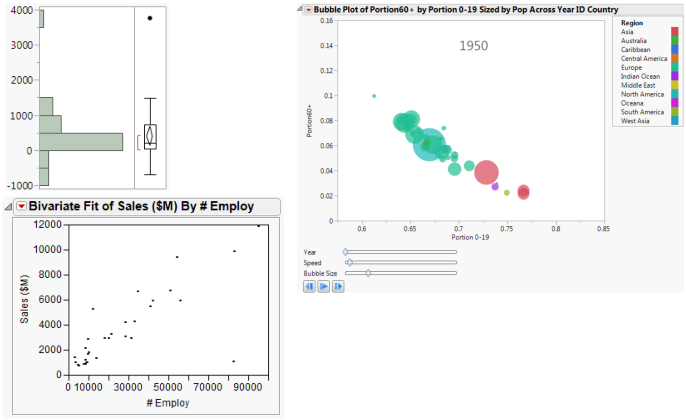
Figure 4.1 Visualizing Data with JMP
Contents
Analyze Single Variables
Histograms
Bar Charts
Compare Multiple Variables
Scatterplots
Scatterplot Matrix
Side-by-Side Box Plots
Graph Builder
Bubble Plots
Overlay Plots
Variability Chart
Want more information? Have questions? Get answers in the JMP User Community (community.jmp.com).