XBar and S charts with Varying Subgroup Sizes Example
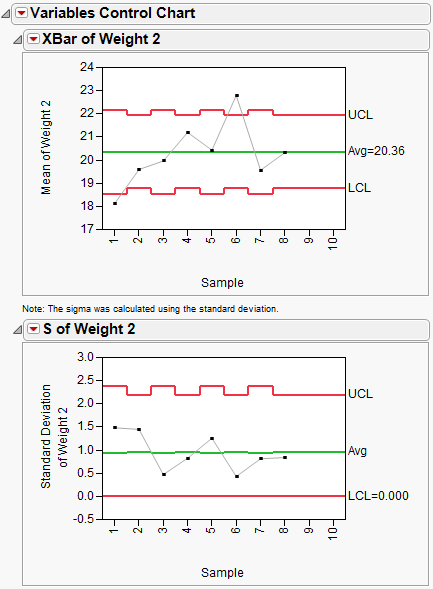
The following example uses the Coating.jmp data table. This quality characteristic of interest is the Weight 2 column. An XBar chart and an S chart for the process are shown in Figure 12.20.
1. Select Help > Sample Data Library and open Quality Control/Coating.jmp.
2. Select Analyze > Quality and Process > Legacy Control Charts > XBar.
3. Select the chart types of XBar and S.
4. Select Weight 2 and click Process.
5. Select Sample and click Sample Label.
The Sample Size option should automatically change to Sample Grouped by Sample Label.
6. Click OK.
Figure 12.20 XBar and S Charts for Varying Subgroup Sizes
Weight 2 has several missing values in the data, so you might notice the chart has uneven limits. Although, each sample has the same number of observations, samples 1, 3, 5, and 7 each have a missing value.
Note: When sample sizes are unequal, the Test options are grayed out. If the samples change while the chart is open and they become equally sized, and the zone or test option is selected, the zones or tests are applied immediately and appear on the chart.
