Analysis of Covariance, Equal Slopes
Here you are interested in testing for the effect of A with X as a covariate. Suppose that you have reason to believe that the effect of X on the response does not depend on the level of A.
Effects to be entered: A, X
1. In the Select Columns list, select one nominal or ordinal effect, A, and one continuous effect, X.
2. Click Add.
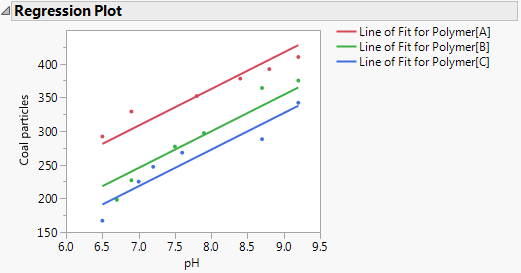
Figure 2.14 shows the data from the Cleansing.jmp sample data table. You are interested in which Polymer removes the most Coal particles from a cleansing tank. However, you suspect that the pH of the tank also has an effect on removal. The plot shows an analysis of covariance fit. Here the slopes relating pH and Coal particles are assumed equal across the levels of Polymer.
The plot in Figure 2.14 is obtained as follows. In the Fit Model window, enter Coal particles as Y and both pH and Polymer in the Construct Model Effects box. Click Run. The Regression Plot appears in the Fit Least Squares report. To color the points, select Rows > Color or Mark by Column, select Polymer from the Mark by Column list, and click OK.
However, a more complete analysis indicates that pH and Polymer do interact in their effect on Coal particles. The appropriate model fit is shown in Analysis of Covariance, Unequal Slopes.
Figure 2.14 Model Fit for Analysis of Covariance, Equal Slopes