Capability Index Plot
The Capability Index Plot shows Ppk values for all variables that you entered as Y, Process. Each variable name appears on the horizontal axis and the Ppk values appear on the vertical axis. If you fit a nonnormal distribution, the fitted distribution name appears in the plot as a parenthetical suffix to the variable name. If process importance values are specified, the points on the capability index plot are sized by importance. A horizontal line is placed at the Ppk value that is specified by the slider to the right of the plot.
Place your cursor over a point in the Capability Index Plot to view a control chart for that process. Click the control chart to launch Control Chart Builder with the corresponding control chart and capability report.
Note: A control chart is not available for a process if the unbiased pooled standard deviation is chosen as the within-group variation statistic for that process.
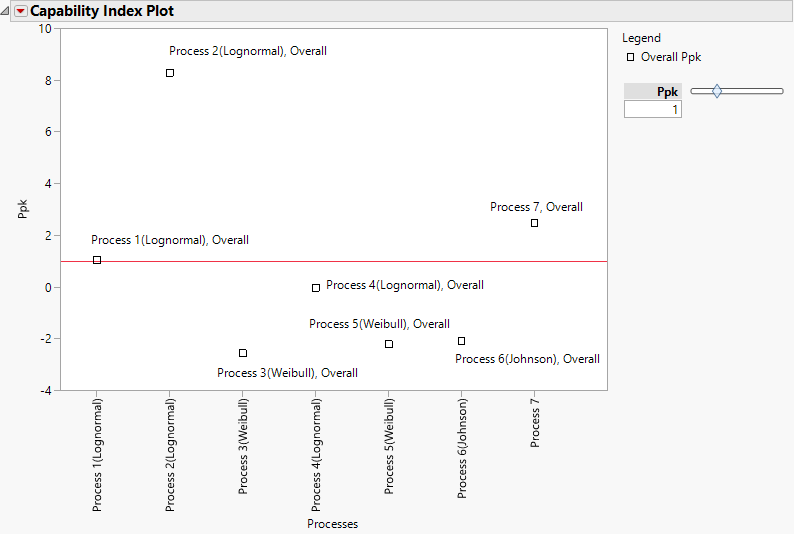
Figure 7.13 shows a Capability Index Plot report for the Process Measurements.jmp sample data table. Seven of the variables are fit with nonnormal distributions. Process 7 is fit with a normal distribution. Points have been labeled using the Label Overall Sigma Points option that is available in the Capability Index Plot red triangle menu.
Figure 7.13 Capability Index Plot with Nonnormal Distributions
Capability Index Plot Options
The Capability Index Plot red triangle menu has the following options:
Show Within Sigma Points
Shows or hides the points calculated using the within sigma estimate.
Show Within or Between-and-Within Sigma Points
(Available only when Calculate Between-and-Within Capability is selected for at least one process in the launch window.) Shows or hides the points calculated using the within sigma estimate or, if specified, the between-and-within sigma estimate.
Show Overall Sigma Points
Shows or hides the points calculated using the overall sigma estimate.
Shade Levels
Shows or hides the Ppk level shading. When you select Shade Levels, shaded areas appear in the plot. The shaded areas are described as follows, with p representing the value shown in the box beneath Ppk:
– Points in the red area have Ppk < p.
– Points in the yellow area have p < Ppk < 2p.
– Points in the green area have 2p < Ppk.
Label Within Sigma Points
Shows or hides labels for points calculated using the within sigma estimate.
Label Within or Between-and-Within Sigma Points
(Available only when Calculate Between-and-Within Capability is selected for at least one process in the launch window.) Shows or hides labels for points calculated using the within sigma estimate or, if specified, the between-and-within sigma estimate.
Label Overall Sigma Points
Shows or hides labels for points calculated using the overall sigma estimate.