Column and Row Tables
In Tabulate, a table is defined by its column headings and row labels. These sub-tables are referred to as row tables and column tables (Figure 9.11).
Example of Row and Column Tables
1. Select Help > Sample Data Library and open Car Poll.jmp.
2. Select Analyze > Tabulate.
3. Drag size into the Drop zone for rows.
4. Drag country to the left of the size heading.
5. Drag Mean over the N heading.
6. Drag Std Dev below the Mean heading.
7. Drag age above the Mean heading.
8. Drag type to the far right of the table.
9. Drag sex under the table.
Figure 9.11 Row and Column Tables
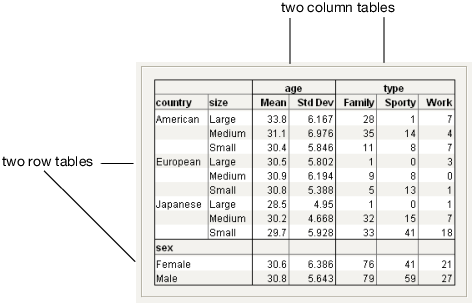
For multiple column tables, the labels on the side are shared across the column tables. In this instance, country and sex are shared across the tables. Similarly, for multiple row tables, the headings on the top are shared among the row tables. In this instance, both age and type are shared among the tables.