Publication date: 04/28/2021
Control Limits for P and NP Charts
The lower and upper control limits, LCL, and UCL, respectively, are computed as:
P chart LCL = 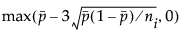
P chart UCL = 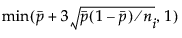
NP chart LCL = 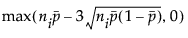
NP chart UCL = 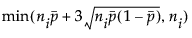
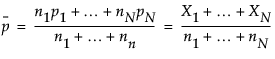
where:
 is the average proportion of nonconforming items taken across subgroups
ni is the number of items in the ith subgroup
Want more information? Have questions? Get answers in the JMP User Community (community.jmp.com).