For the latest version of JMP Help, visit JMP.com/help.


Quality and Process Methods > Control Chart Builder
Publication date: 04/28/2021

Control Chart Builder

Create Control Charts Interactively

A control chart is a graphical and analytic tool for monitoring process variation. The natural variation in a process can be quantified using a set of control limits. Control limits help distinguish common-cause variation from special-cause variation. Typically, action is taken to identify and eliminate special-cause variation. It is also important to quantify the common-cause variation in a process, as this determines the capability of a process.

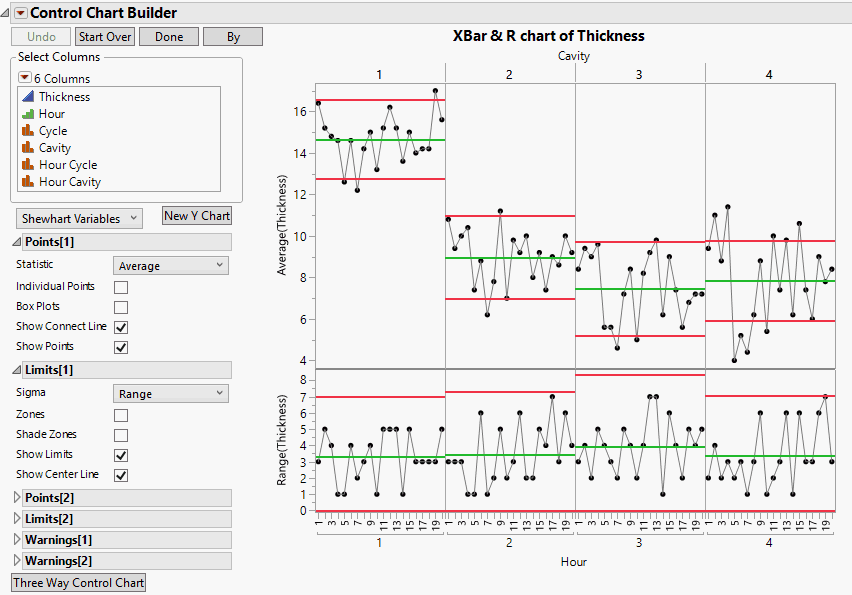
Use Control Chart Builder to create control charts of your process data. Control Chart Builder can be launched as an interactive workspace or from specific control chart menu options. In the interactive workspace, you select the variables that you want to chart and drag them into zones. JMP automatically chooses an appropriate chart type based on the data. You can quickly create another type of chart, or change the current settings for an existing chart.

Figure 3.1 Control Chart Builder Example 

Contents

Overview of Control Chart Builder

Example of Control Chart Builder

Control Chart Types

Shewhart Control Charts for Variables
Shewhart Control Charts for Attributes
Rare Event Control Charts
Control Chart Types

Launch Control Chart Builder

Interactive Workspace
Launch Windows for Specific Control Charts

Control Chart Builder Window

Control Chart Builder Options

Red Triangle Menu Options
Options Panel and Right-Click Chart Options
Right-Click Axis Options

Work with Control Limits

Example of Control Limits

Excluded and Hidden Samples

Additional Examples of Control Chart Builder

XBar and R Chart Phase Example
P chart Example
NP chart Example
C chart Example
U chart Example
G chart Example
T chart Example
Three Way Control Chart Example

Statistical Details for Control Chart Builder

Control Limits for XBar and R Charts
Control Limits for XBar and S Charts
Control Limits for Individual Measurement and Moving Range Charts
Control Limits for P and NP Charts
Control Limits for U Charts and C Charts
Levey-Jennings Charts
Control Limits for G Charts
Control Limits for T Charts
Control Limits for Three Way Control Charts
Want more information? Have questions? Get answers in the JMP User Community (community.jmp.com).