Publication date: 04/28/2021
Three Way Control Chart Example
Three way control charts are useful when there is variation between batches and variation within batches.
1. Select Help > Sample Data Library and open Quality Control/Vial Fill Weights.jmp.
2. Select Analyze > Quality and Process > Control Chart > Three Way Control Chart.
3. Select Fill Weight and click Y.
4. Select Sample and click Subgroup.
5. Click OK.
Figure 3.26 Three Way Control Chart for Fill Weight
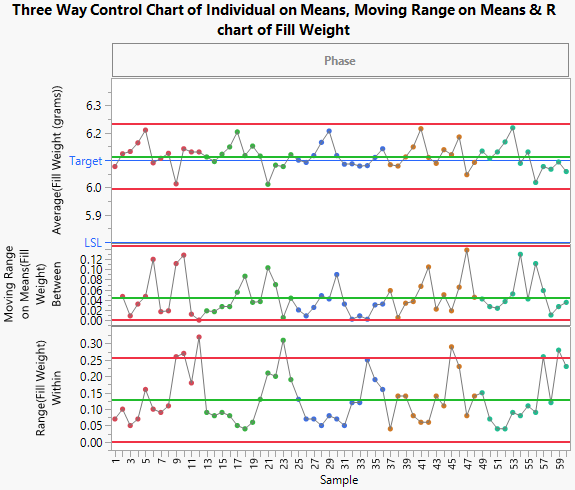
A Moving Range chart appears between the Range and Average charts. The limits on the Average (XBar) chart are now calculated using the moving range between each sample.
Want more information? Have questions? Get answers in the JMP User Community (community.jmp.com).