Publication date: 04/28/2021
Levey-Jennings Charts
Levey-Jennings charts show a process mean with control limits based on a long-term sigma. The control limits are placed at 3s distance from the center line.
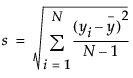
The standard deviation, s, for the Levey-Jennings chart is calculated the same way standard deviation is in the Distribution platform.
Want more information? Have questions? Get answers in the JMP User Community (community.jmp.com).