Control Limits for XBar and R Charts
JMP generates control limits for XBar and R charts as:
LCL for XBar chart = 
UCL for XBar chart = 
LCL for R chart = 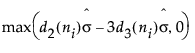
UCL for R chart = 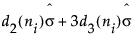
Center line for R chart: By default, the center line for the ith subgroup (where 3 is the sigma multiplier) indicates an estimate of the expected value of Ri. This value is computed as:  , where
  is an estimate of σ.
The standard deviation for XBar and R charts is estimated by:
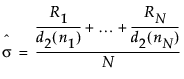
where:
 = weighted average of subgroup means
σ = process standard deviation
ni = sample size of ith subgroup
d2(n) is the expected value of the range of n independent normally distributed variables with unit standard deviation
d3(n) is the standard deviation of the range of n independent normally distributed variables with unit standard deviation
Ri is the range of ith subgroup
N is the number of subgroups for which ni ≥ 2.