Publication date: 04/28/2021
Control Limits for U Charts and C Charts
The lower and upper control limits, LCL, and UCL, are computed as:
U chart LCL = 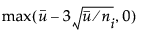
U chart UCL = 
C chart LCL = 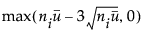
C chart UCL = 
The limits vary with ni.
ui is the number of nonconformities per unit in the ith subgroup. In general, ui = ci/ni.
ci is the total number of nonconformities in the ith subgroup
ni is the number of inspection units in the ith subgroup
 is the average number of nonconformities per unit taken across subgroups. The quantity
  is computed as a weighted average
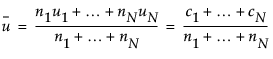
N is the number of subgroups
Want more information? Have questions? Get answers in the JMP User Community (community.jmp.com).