NP chart Example
The Bottle Tops.jmp sample data contains simulated data from a bottle top manufacturing process. Sample is the sample ID number for each bottle. Status indicates whether the bottle top conformed to the design standards. In the Phase column, the first phase represents the time before the process adjustment. The second phase represents the time after the process adjustment. Notes on changes in the process are also included.
1. Select Help > Sample Data Library and open Quality Control/Bottle Tops.jmp.
2. Select Analyze > Quality and Process > Control Chart Builder.
3. Drag Sample to the Subgroup role.
4. Drag Status to the Y role.
Figure 3.19 NP chart of Status (Nonconforming)
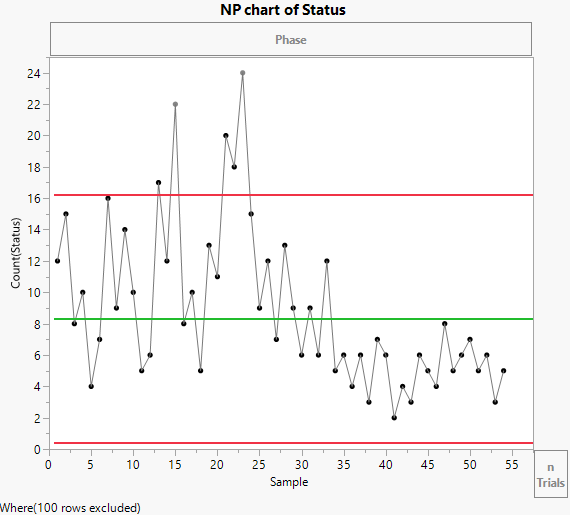
The original observations appear to have high variability and there are five observations (Samples 13, 15, 21, 22 and 23) that are outside of the upper control limit. Samples 15 and 23 note that new material and a new operator were introduced into the process, respectively. At the end of the phase, an adjustment was made to the manufacturing equipment. Therefore, the control limits for the entire series should not be used to assess the control during phase 2.
To compute separate control limits for each phase:
5. Drag Phase to the Phase zone.
Figure 3.20 NP chart by Phase
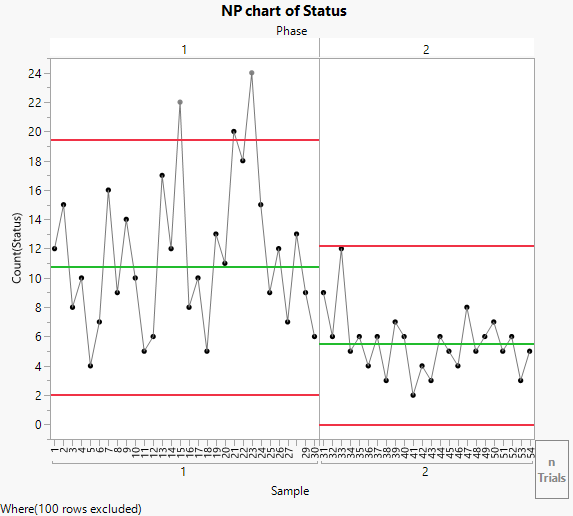
Including the Phase variable means that the control limits for phase 2 are based only on the data for phase 2. None of the phase 2 observations are outside the control limits. Therefore, you can conclude that the process is in control after the adjustment.